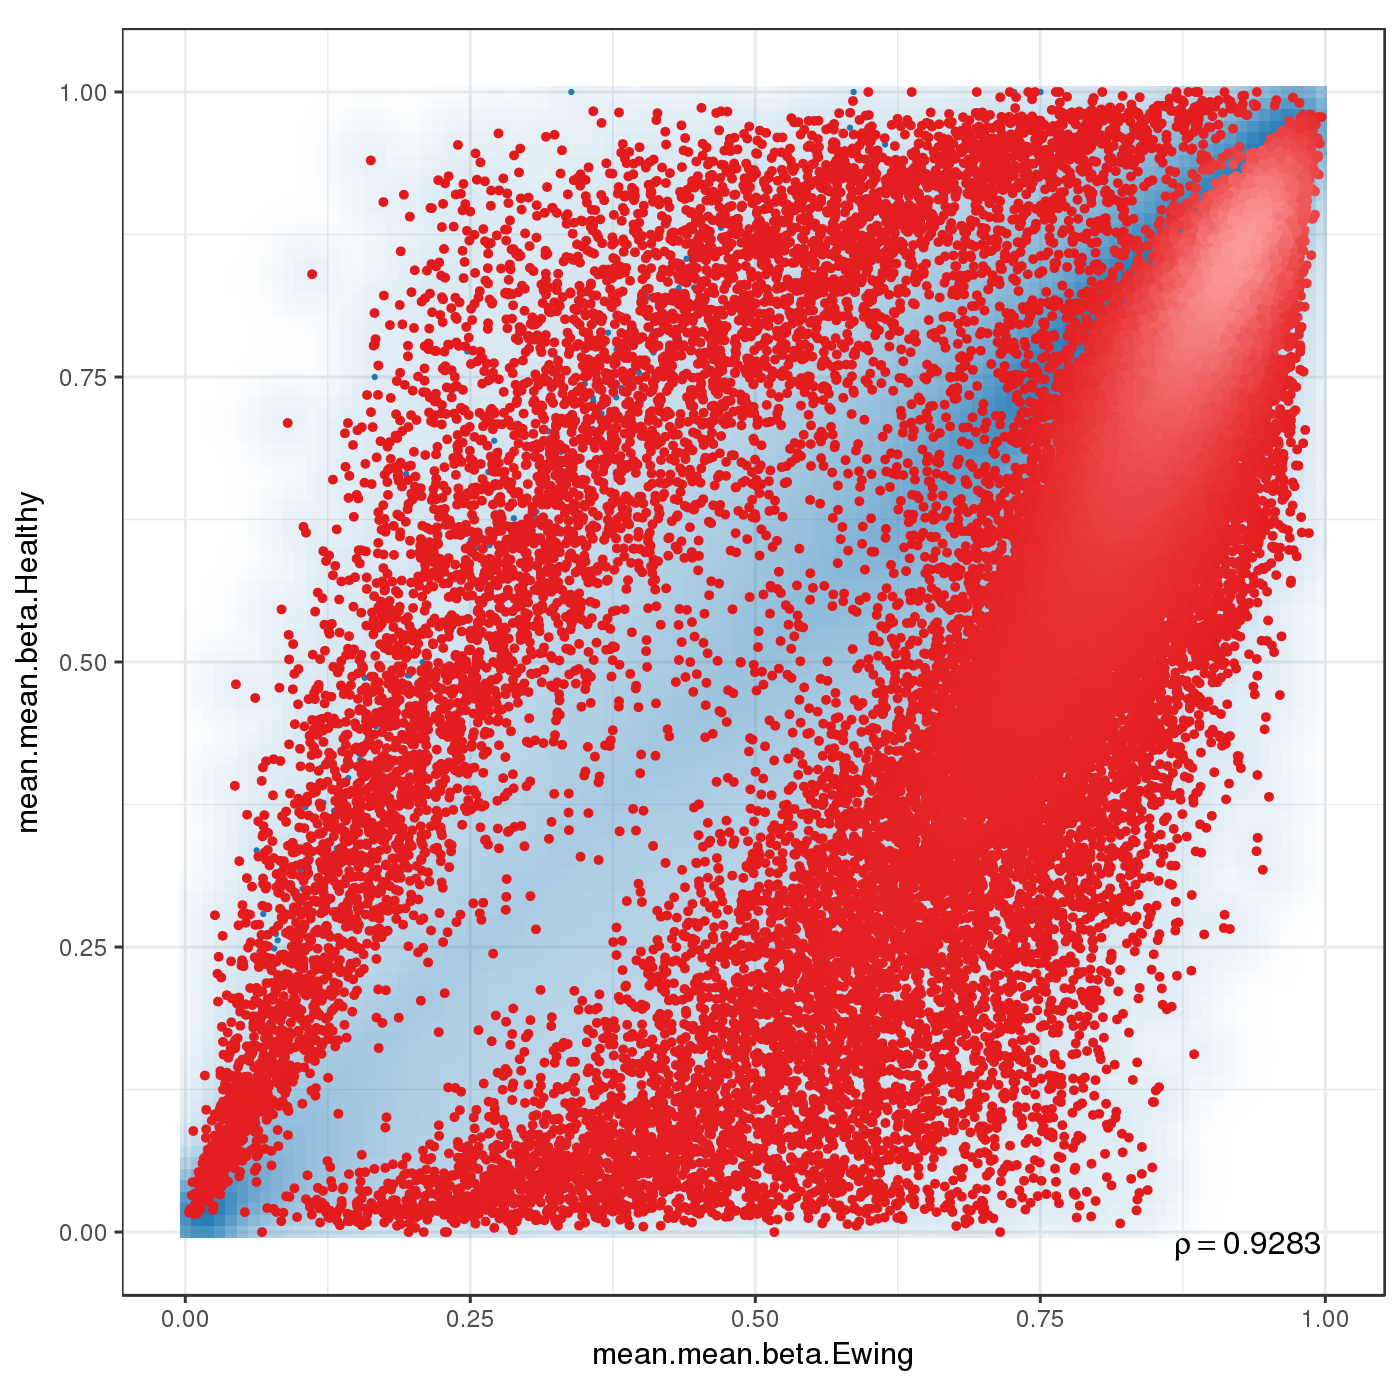
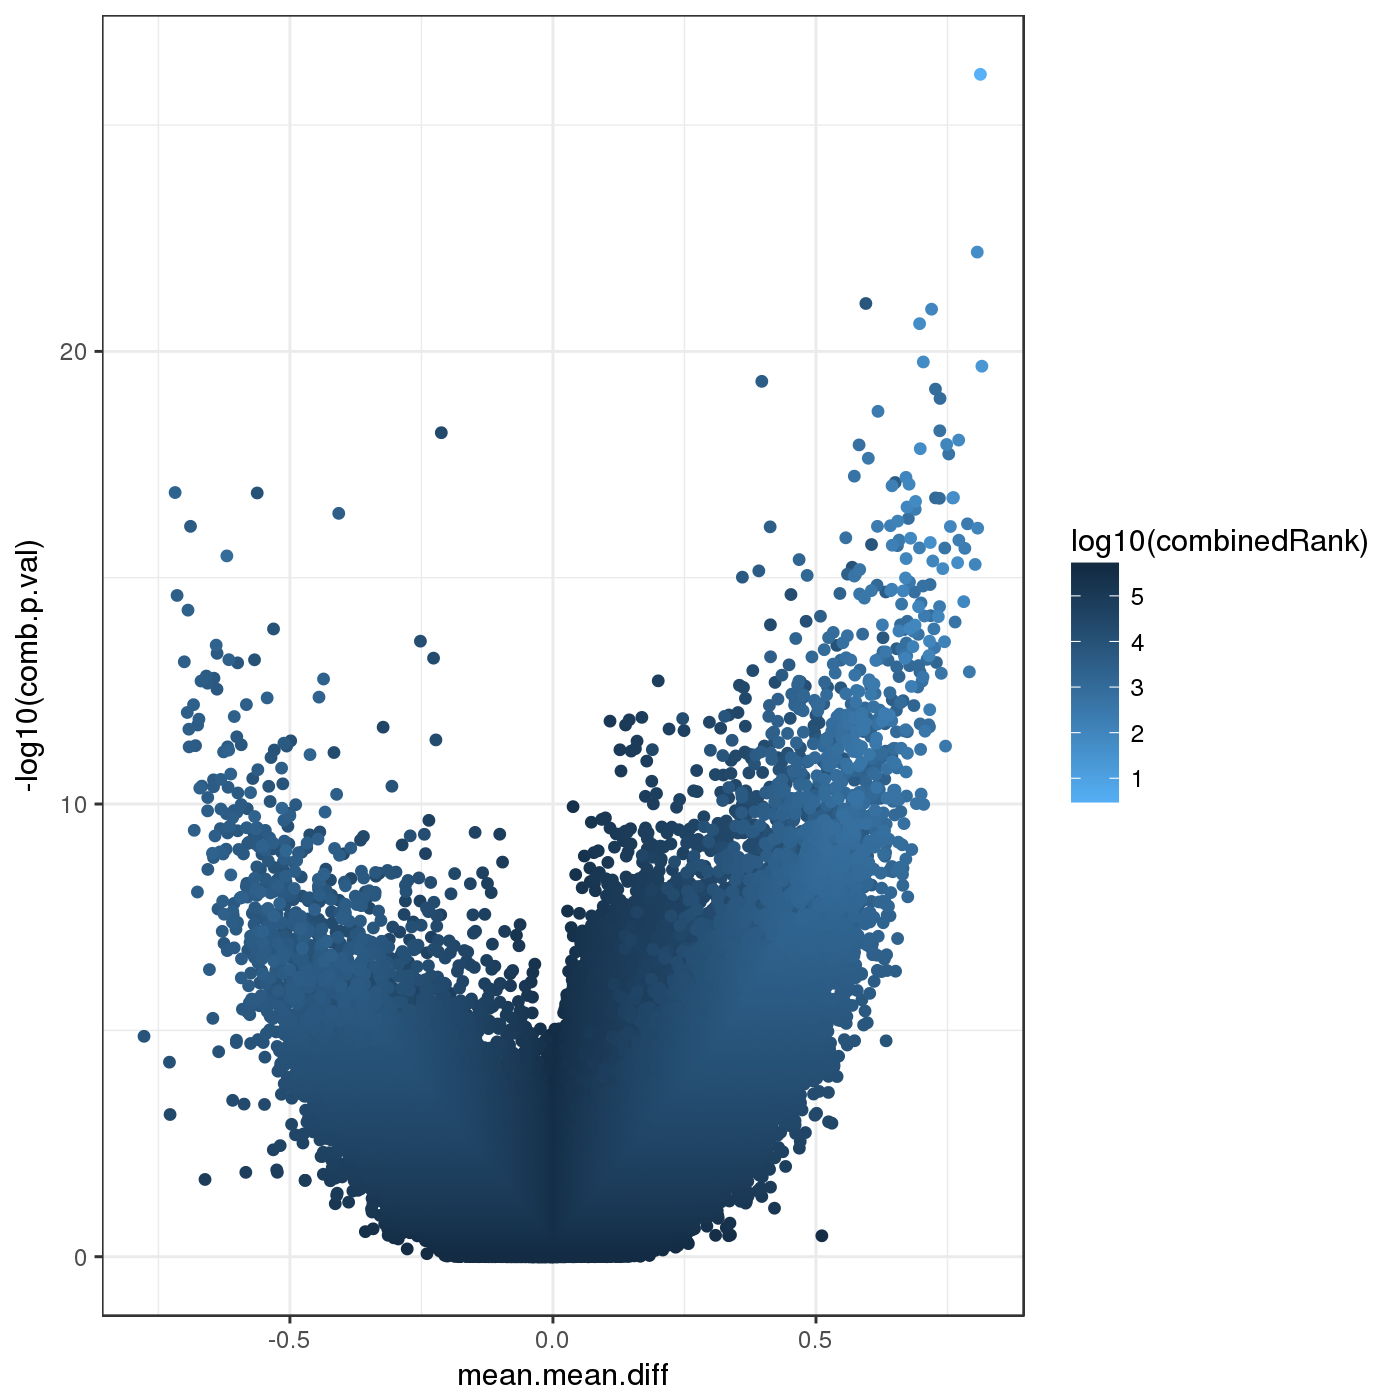
Differential methylation on the site level was computed based on a variety of metrics. Of particular interest for the following plots and analyses are the following quantities for each site: a) the difference in mean methylation levels of the two groups being compared, b) the quotient in mean methylation and c) a statistical test (limma or t-test depending on the settings) assessing whether the methylation values in the two groups originate from distinct distributions. Additionally each site was assigned a rank based on each of these three criteria. A combined rank is computed as the maximum (i.e. worst) rank among the three ranks. The smaller the combined rank for a site, the more evidence for differential methylation it exhibits. This section includes scatterplots of the site group means as well as volcano plots of each pairwise comparison colored according to the combined ranks or p-values of a given site.
The following rank cutfoffs have been automatically selected for the analysis of differentially methylated sites:
| Rank Cutoff | |
| Ewing vs. Healthy (based on disease_type) | 91956 |
| Ewing_Cell_Line vs. non.Ewing_Cell_Line (based on disease_type_detailed) | 71879 |
| Ewing_Tumor vs. non.Ewing_Tumor (based on disease_type_detailed) | 75419 |
| MSC_Ewing vs. non.MSC_Ewing (based on disease_type_detailed) | 73210 |
| MSC_normal vs. non.MSC_normal (based on disease_type_detailed) | 91956 |
| Graz vs. non.Graz (based on sample_source) | 331571 |
| Münster vs. non.Münster (based on sample_source) | 273050 |
| Paris vs. non.Paris (based on sample_source) | 222226 |
| Vienna vs. non.Vienna (based on sample_source) | 201492 |
| abdomen vs. non.abdomen (based on tumor_location) | 283168 |
| head_and_neck vs. non.head_and_neck (based on tumor_location) | 335505 |
| lower_extremity vs. non.lower_extremity (based on tumor_location) | 231115 |
| pelvis vs. non.pelvis (based on tumor_location) | 244007 |
| spine vs. non.spine (based on tumor_location) | 255517 |
| thorax vs. non.thorax (based on tumor_location) | 228900 |
| upper_extremity vs. non.upper_extremity (based on tumor_location) | 249541 |
| greater_than_200mL vs. less_than_200mL (based on tumor_size) | 409269 |
| no_relapse vs. relapse (based on relapse) | 156026 |
| metastases vs. no_metastases (based on metastases_at_diagnosis) | 164839 |
| Ewing_Cell_Line vs. Ewing_Tumor (based on comp.column) | 59565 |
| Ewing_Tumor vs. MSC (based on Tissue_vs_MSC) | 123532 |
| comparison | |
| differential methylation measure |
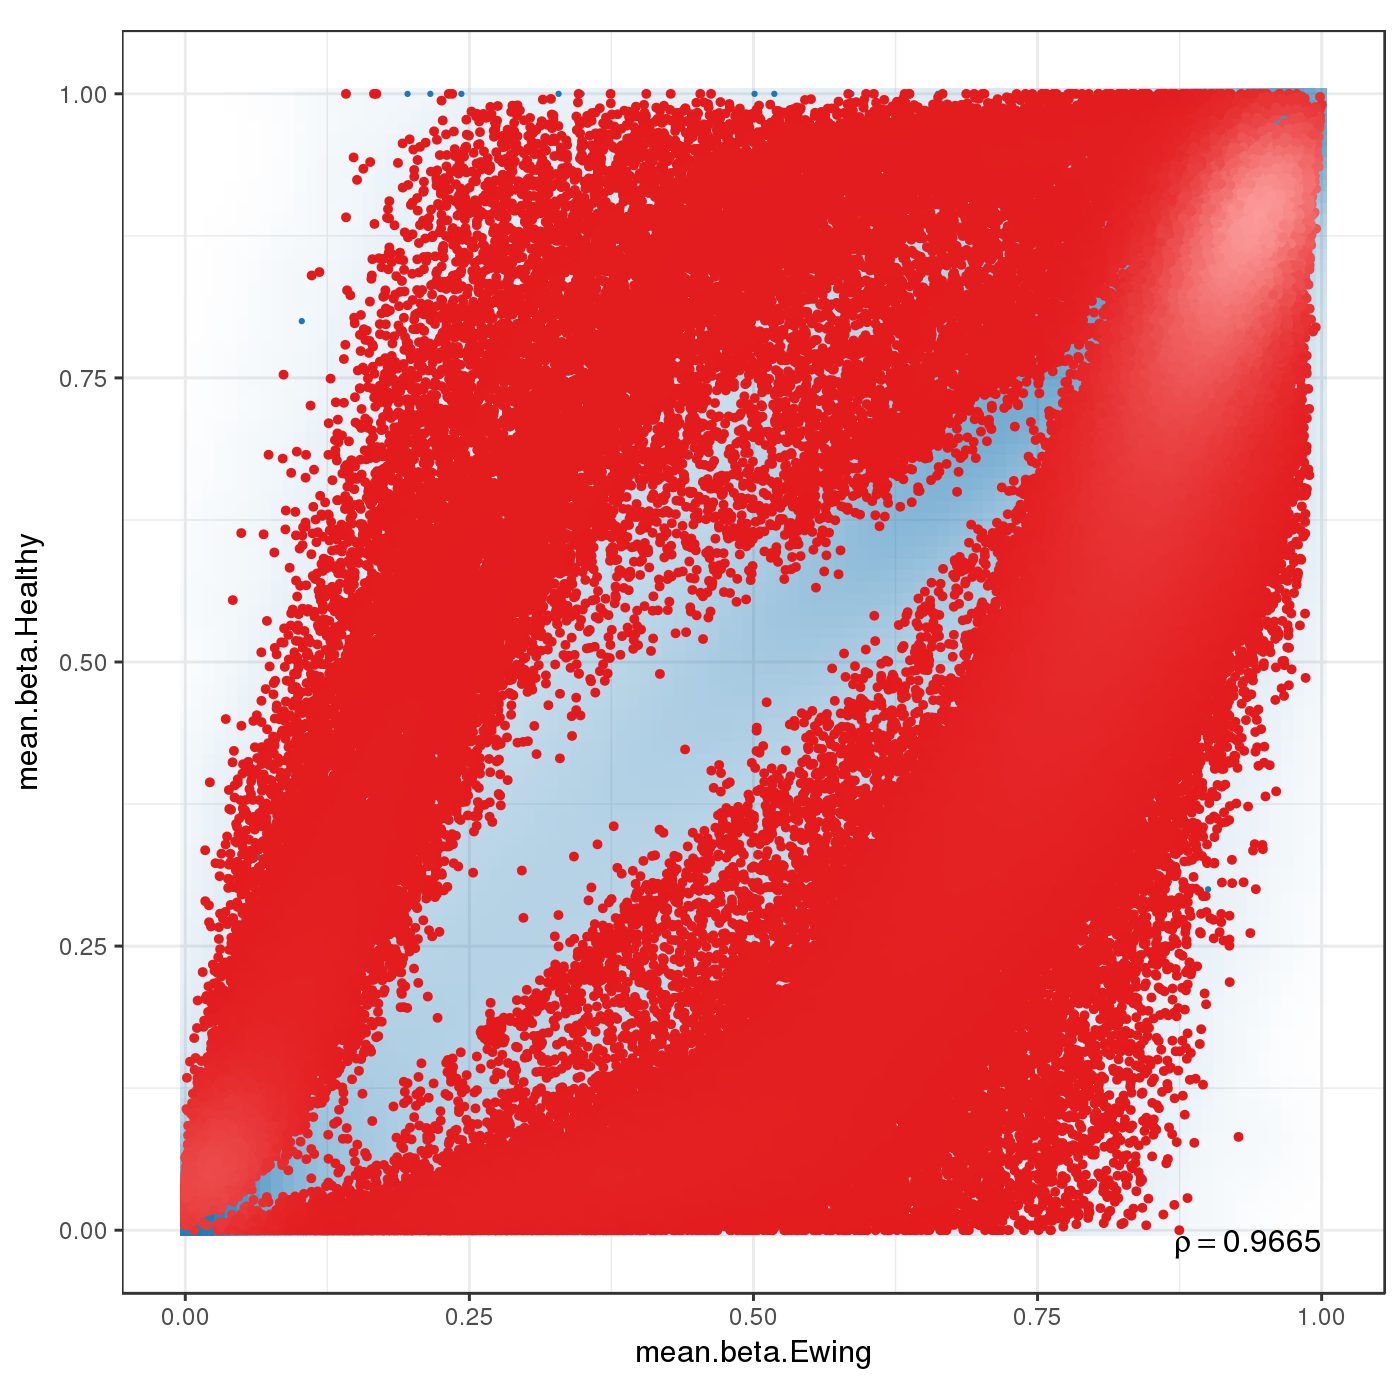
Scatterplot for differential methylation (sites). If the selected criterion is not rankGradient:
The transparency corresponds to point density. If the number of points exceeds 2e+06 then the number of points for density estimation is reduced to that number by random sampling.The1% of the points in the sparsest populated plot regions are drawn explicitly (up to a maximum of 10000 points).Additionally, the colored points represent differentially methylated sites (according to the selected criterion).
If the selected criterion is rankGradient: median combined ranks accross hexagonal bins are shown
as a gradient according to the color legend.
| comparison | |
| difference metric | |
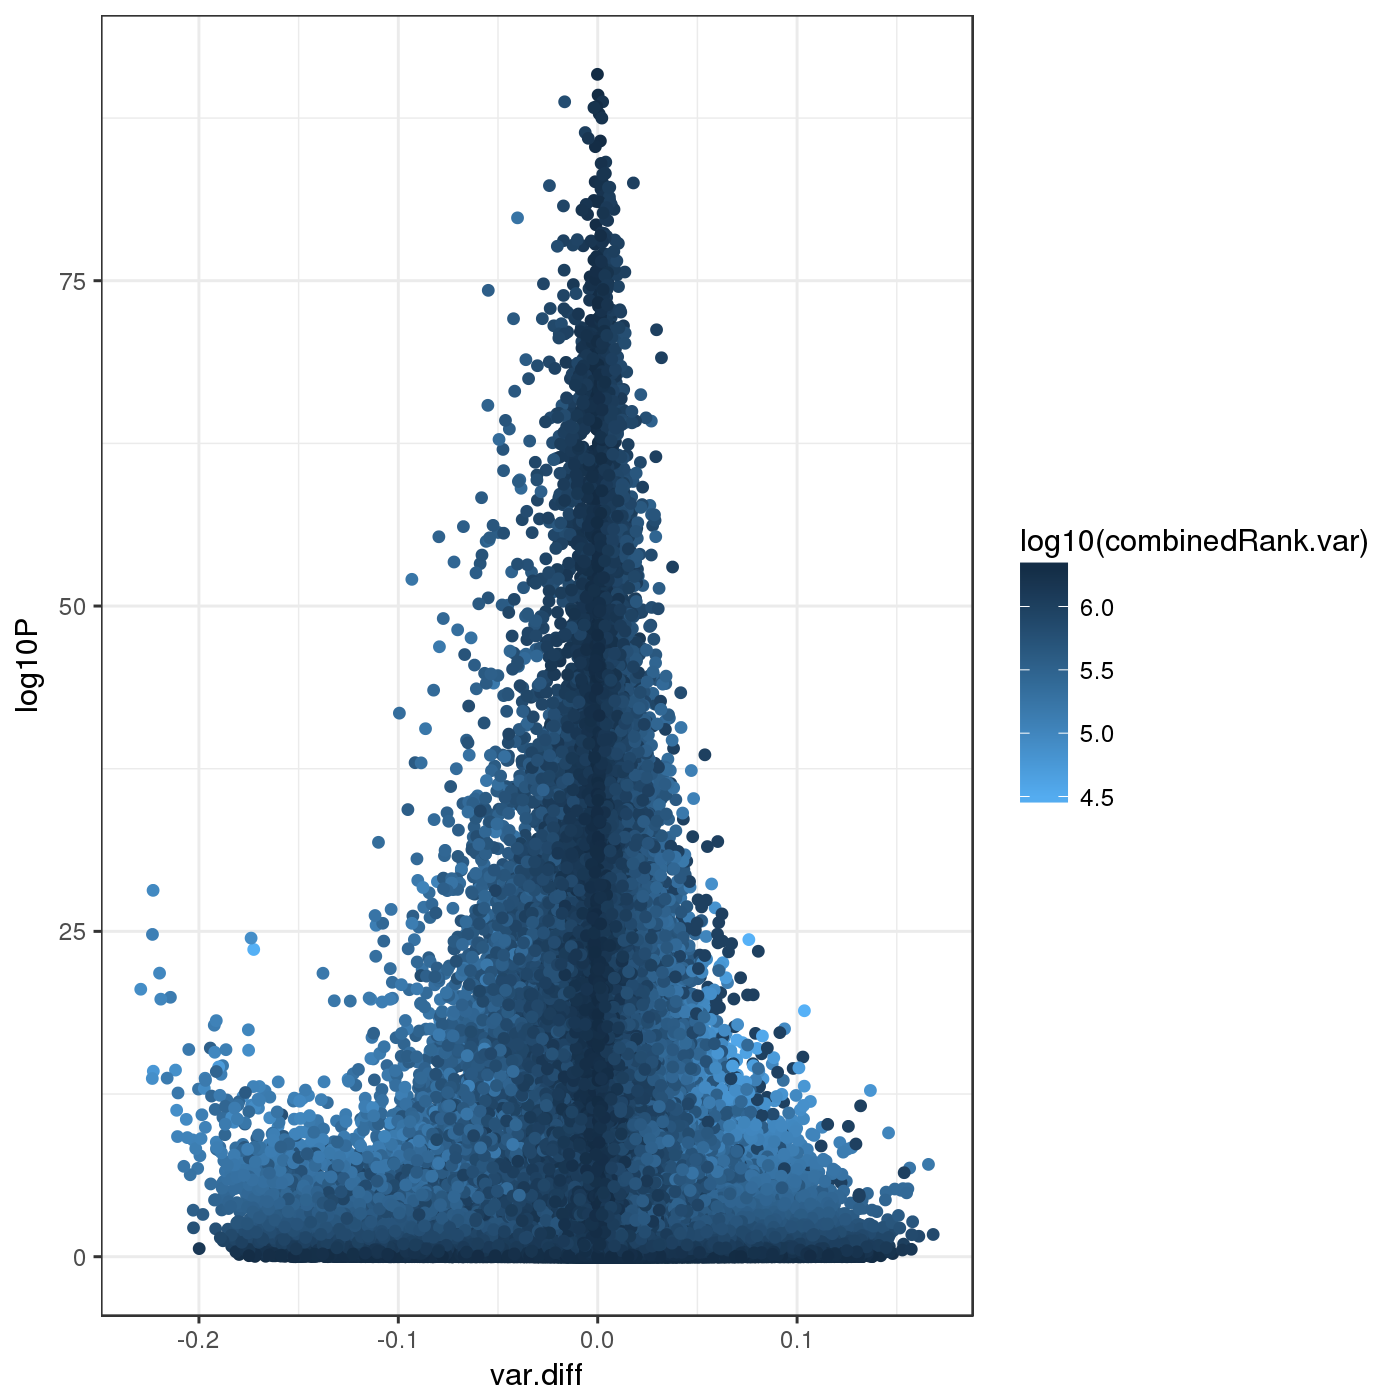
| significance metric |
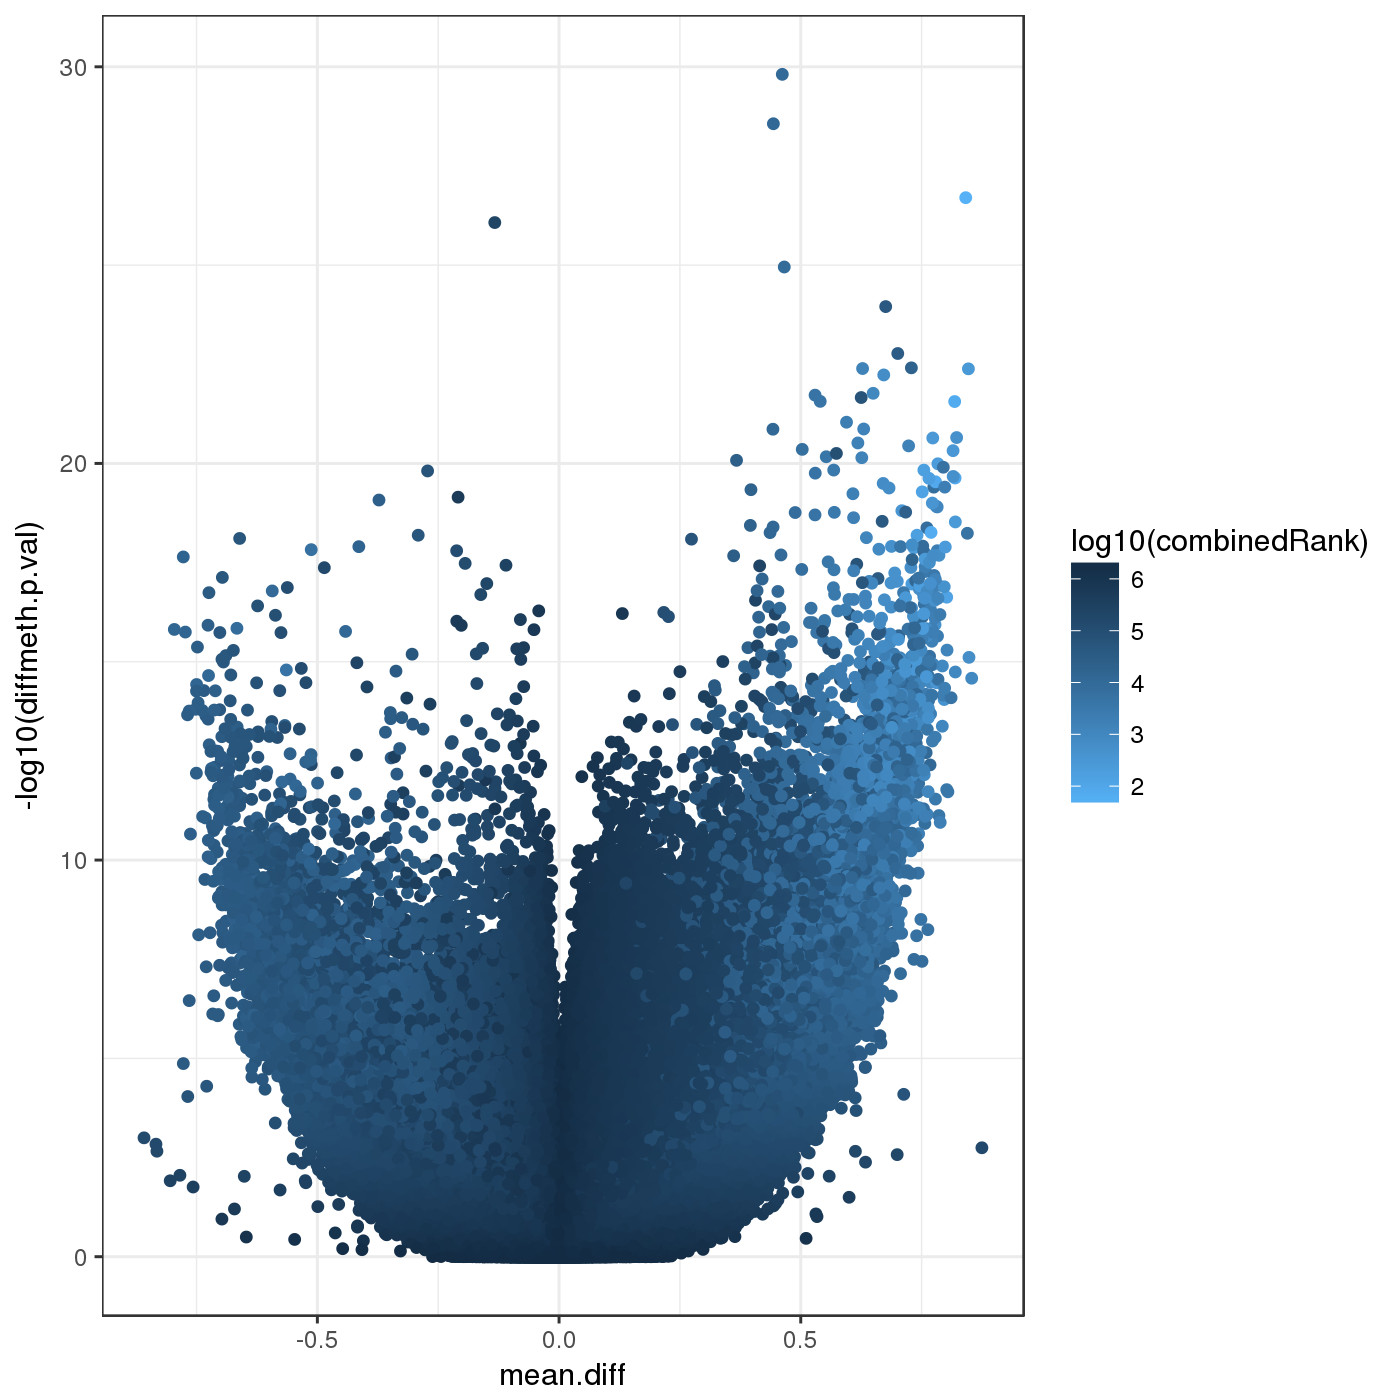
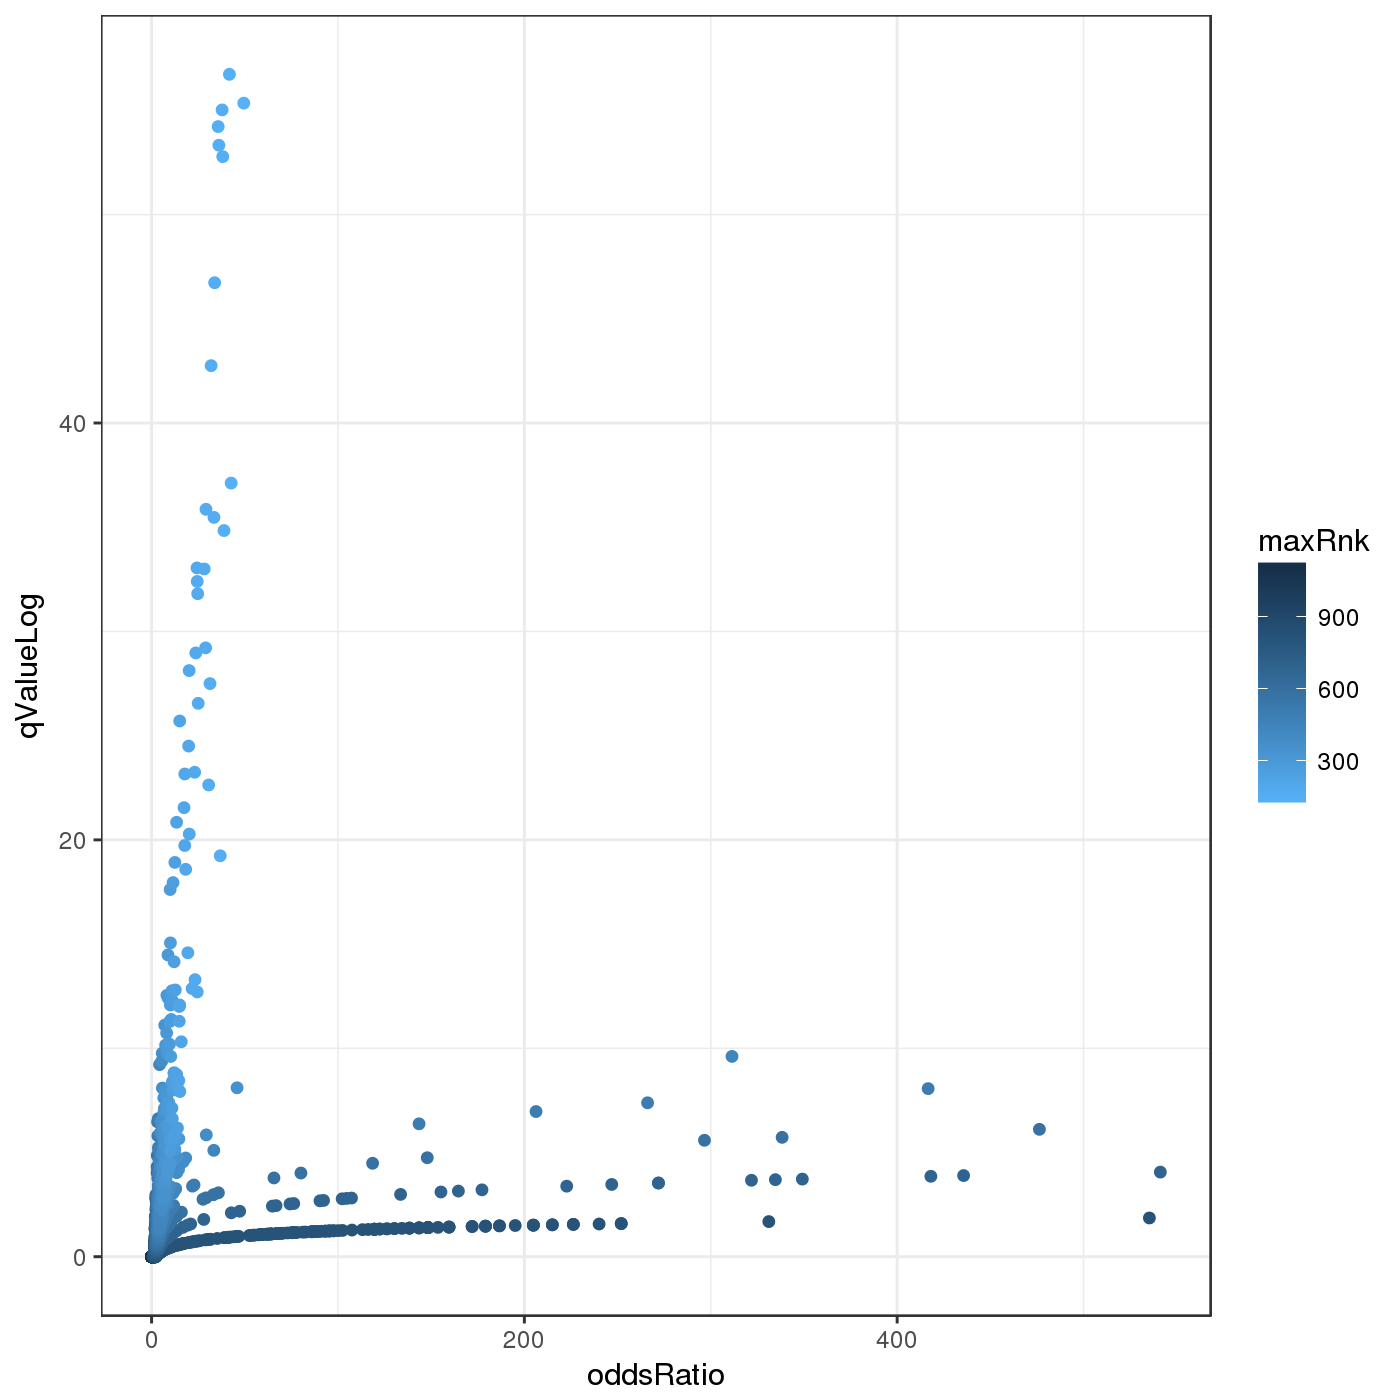
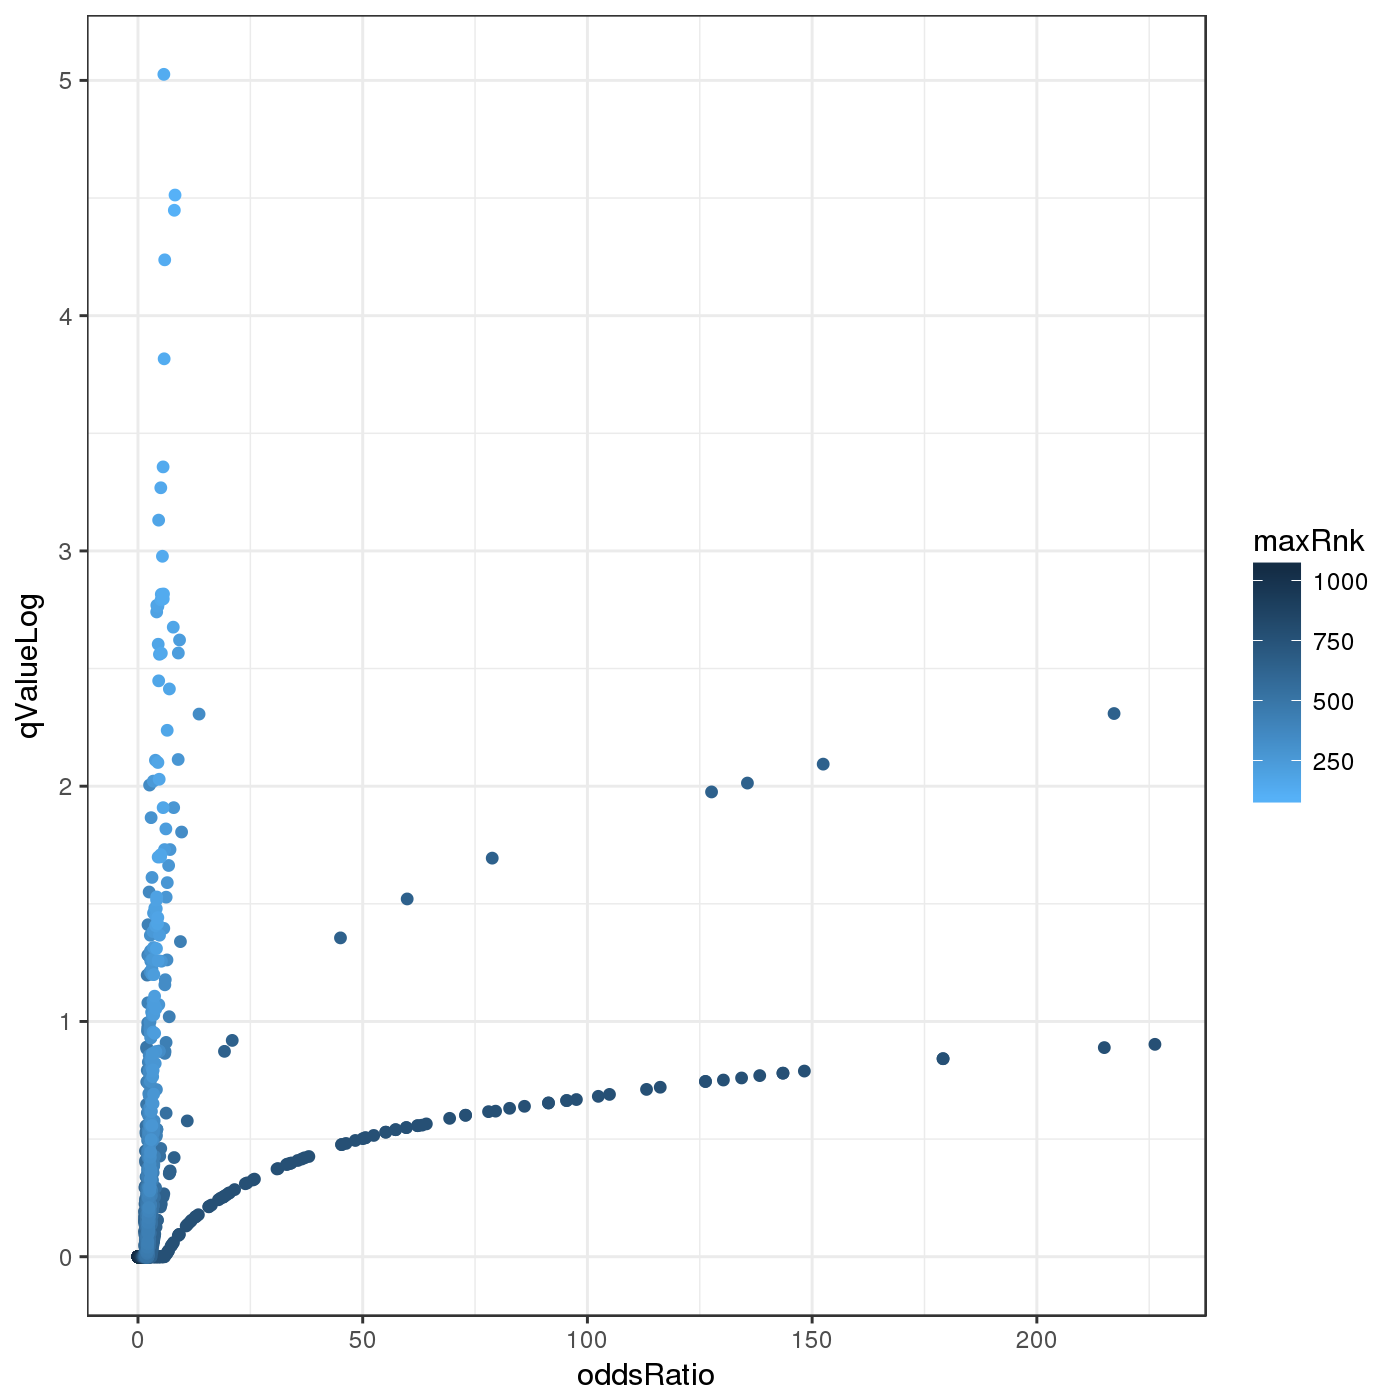
Volcano plot for differential methylation quantified by various metrics. Color scale according to combined ranking.
Differential Methylation Tables
A tabular overview of measures for differential methylation on the site level for the individual comparisons are provided in this section. Below, a brief explanation of the different columns can be found:
- id: site id
- Chromosome: chromosome of the site
- Start: start coordinate of the site
- Strand: strand of the site
- mean.g1,mean.g2: (where g1 and g2 is replaced by the respective group names in the table) mean methylation in each of the two groups
- mean.diff: difference in methylation means between the two groups: mean.g1-mean.g2. In case of paired analysis, it is the mean of the pairwise differences.
- mean.quot.log2: log2 of the quotient in methylation: log2((mean.g1+epsilon)/(mean.g2+epsilon)), where epsilon:=0.01. In case of paired analysis, it is the mean of the pairwise quotients.
- diffmeth.p.val: p-value obtained from linear models employed in the limma package (or alternatively from a two-sided Welch t-test; which type of p-value is computed is specified in the differential.site.test.method option).
- max.g1,max.g2: maximum methylation level in group 1 and 2 respectively
- min.g1,min.g2: minimum methylation level in group 1 and 2 respectively
- sd.g1,sd.g2: standard deviation of methylation levels
- min.diff: Minimum of 0 and the smallest pairwise difference between samples of the two groups
- diffmeth.p.adj.fdr: FDR adjusted p-value of all sites
- combinedRank: mean.diff, mean.quot.log2 and diffmeth.p.val are ranked for all sites. This aggregates them using the maximum, i.e. worst rank of a site among the three measures
- num.na.g1,num.na.g2: number of NA methylation values for groups 1 and 2 respectively
- mean.covg.g1,mean.covg.g2: mean coverage of groups 1 and 2 respectively (In case of Infinium array methylation data, coverage is defined as combined beadcount.)
- min.covg.g1,min.covg.g2: minimum coverage of groups 1 and 2 respectively
- max.covg.g1,max.covg.g2: maximum coverage of groups 1 and 2 respectively
- covg.thresh.nsamples.g1,covg.thresh.nsamples.g2: number of samples in group 1 and 2 respectively exceeding the coverage threshold (5) for this site.
- Strand: strand of the site
- var.g1, var.g2: (g1 and g2 are replaced by the corrspondinhg group used in the differentiality analysis) the variances found in the groups
- var.diff: difference in variance values between the two groups g1 and g2 (=var.g1-var.g2). In case of paired analysis, it is the variance of the pairwise differences.
- var.log.ratio: Log2 of the ratio between the variances of the two groups g1 and g2 (=log2(var.g1+eps/var.g2+eps), default eps=0.01). In case of paired analysis, it is the variance of the pairwise quotients.
- diffVar.p.val: p-value resulting from applying the selected differentially variability method (diffVar or iEVORA)
- diffVar.p.adj.fdr: FDR-adjusted p-value for differential variability
- log10P: negative decadic logarithm of the p-value
- log10FDR: negative decadic logarithmn of the FDR-adjusted p-value
- combinedRank.var: var.diff, var.log.ratio and comb.p.val.var are ranked for all sites and the higher (=worst) rank is selected.
The tables for the individual comparisons can be found here:
- Ewing vs. Healthy (based on disease_type)
- Ewing_Cell_Line vs. non.Ewing_Cell_Line (based on disease_type_detailed)
- Ewing_Tumor vs. non.Ewing_Tumor (based on disease_type_detailed)
- MSC_Ewing vs. non.MSC_Ewing (based on disease_type_detailed)
- MSC_normal vs. non.MSC_normal (based on disease_type_detailed)
- Graz vs. non.Graz (based on sample_source)
- Münster vs. non.Münster (based on sample_source)
- Paris vs. non.Paris (based on sample_source)
- Vienna vs. non.Vienna (based on sample_source)
- abdomen vs. non.abdomen (based on tumor_location)
- head_and_neck vs. non.head_and_neck (based on tumor_location)
- lower_extremity vs. non.lower_extremity (based on tumor_location)
- pelvis vs. non.pelvis (based on tumor_location)
- spine vs. non.spine (based on tumor_location)
- thorax vs. non.thorax (based on tumor_location)
- upper_extremity vs. non.upper_extremity (based on tumor_location)
- greater_than_200mL vs. less_than_200mL (based on tumor_size)
- no_relapse vs. relapse (based on relapse)
- metastases vs. no_metastases (based on metastases_at_diagnosis)
- Ewing_Cell_Line vs. Ewing_Tumor (based on comp.column)
- Ewing_Tumor vs. MSC (based on Tissue_vs_MSC)
Differential Variability
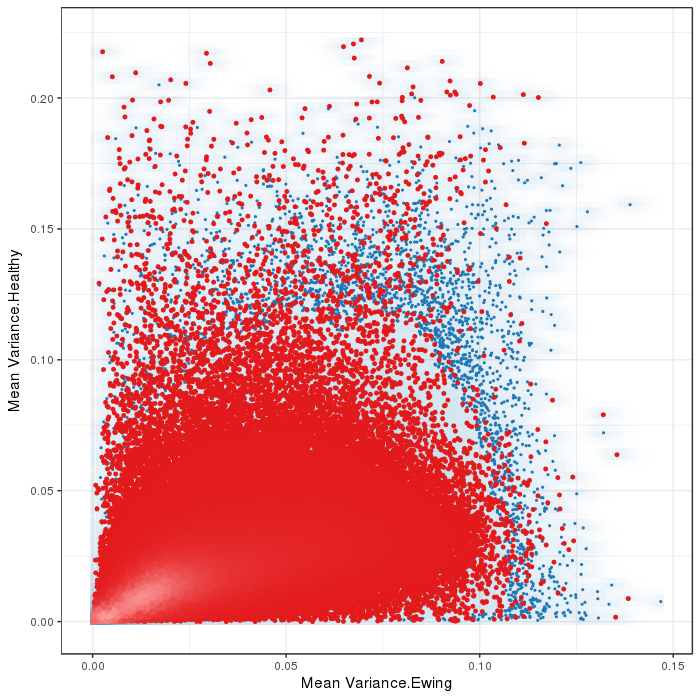
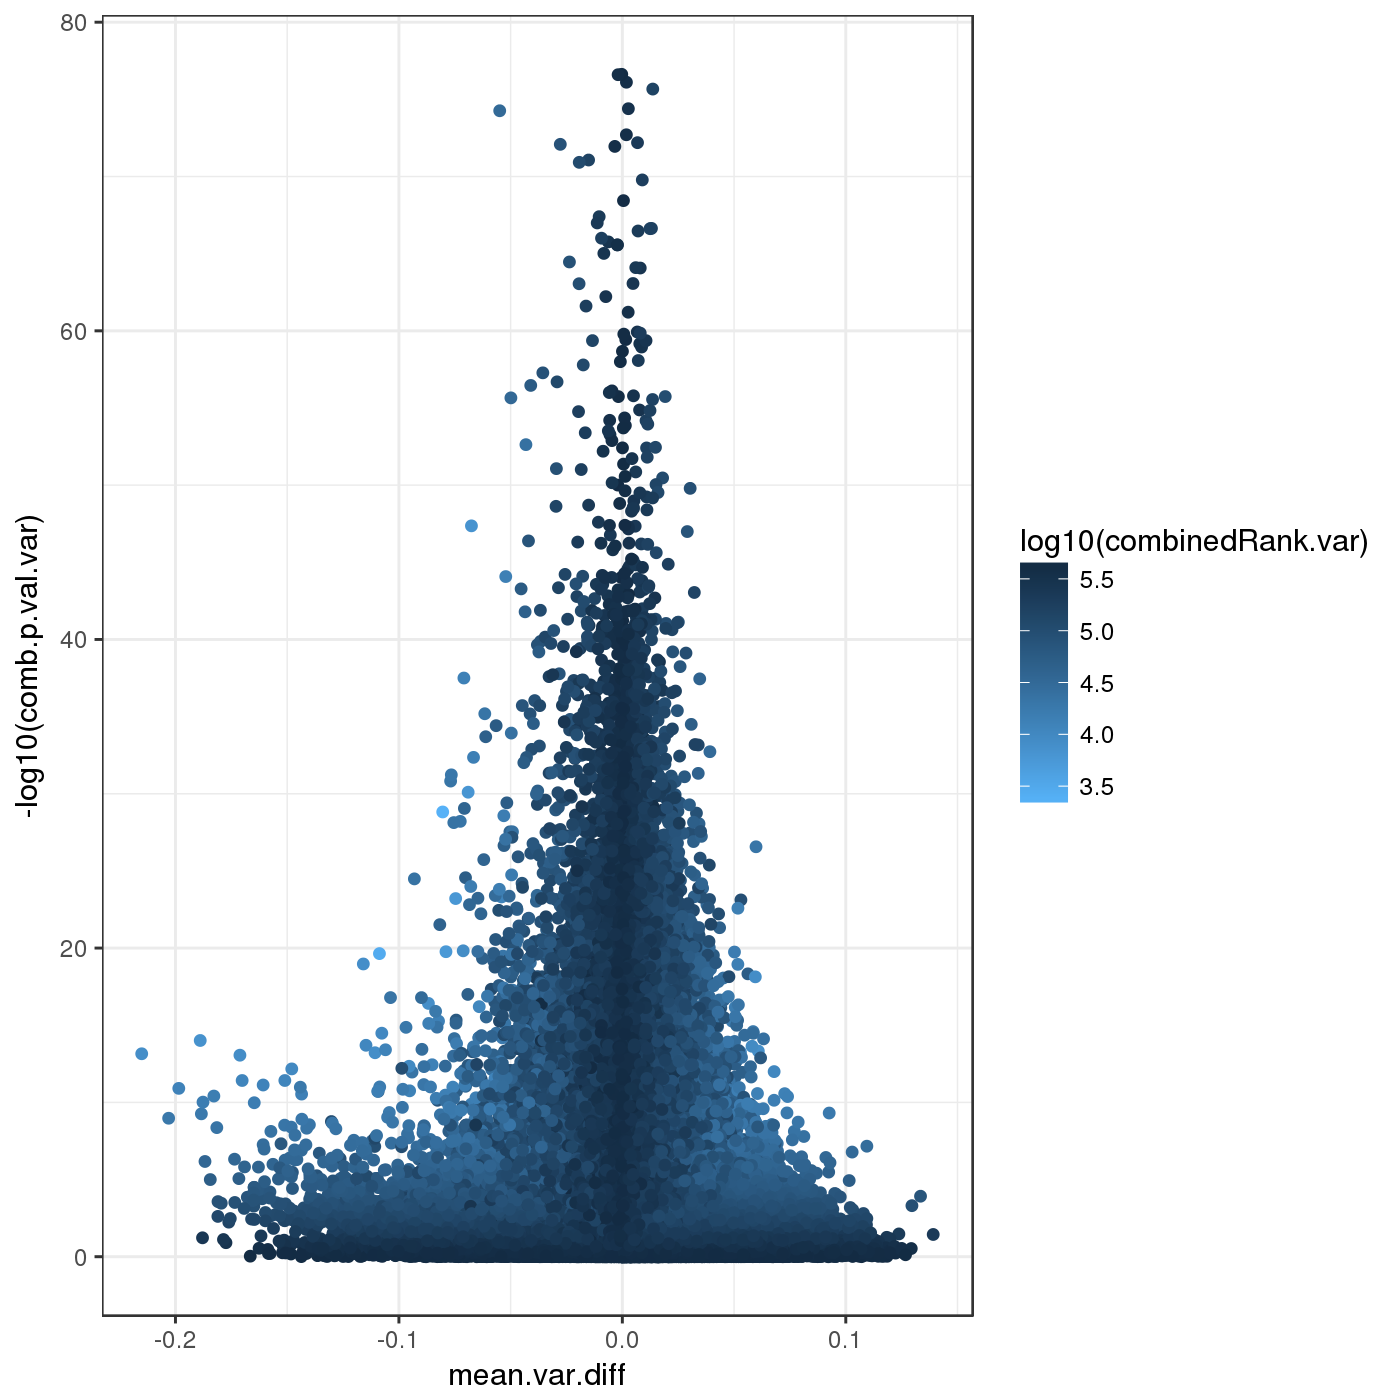
Differentially variable sites were computed with diffVar. For more information about the method, have a look at the missMethyl Bioconductor package.[1] This section contains plots and tables describing the results of this test and further analyses of the sites that were selected as differentially variable. Please note that missing methylation values have been imputed with none.
The following rank cutoffs have been automatically selected for the analysis of differentially variable sites:
| Rank Cutoff | |
| Ewing vs. Healthy (based on disease_type) | 37696 |
| Ewing_Cell_Line vs. non.Ewing_Cell_Line (based on disease_type_detailed) | 41266 |
| Ewing_Tumor vs. non.Ewing_Tumor (based on disease_type_detailed) | 49972 |
| MSC_Ewing vs. non.MSC_Ewing (based on disease_type_detailed) | 95107 |
| MSC_normal vs. non.MSC_normal (based on disease_type_detailed) | 37696 |
| Graz vs. non.Graz (based on sample_source) | 165164 |
| Münster vs. non.Münster (based on sample_source) | 117306 |
| Paris vs. non.Paris (based on sample_source) | 91799 |
| Vienna vs. non.Vienna (based on sample_source) | 76835 |
| abdomen vs. non.abdomen (based on tumor_location) | 40305 |
| head_and_neck vs. non.head_and_neck (based on tumor_location) | 84587 |
| lower_extremity vs. non.lower_extremity (based on tumor_location) | 86053 |
| pelvis vs. non.pelvis (based on tumor_location) | 76683 |
| spine vs. non.spine (based on tumor_location) | 97190 |
| thorax vs. non.thorax (based on tumor_location) | 81168 |
| upper_extremity vs. non.upper_extremity (based on tumor_location) | 42071 |
| greater_than_200mL vs. less_than_200mL (based on tumor_size) | 80857 |
| no_relapse vs. relapse (based on relapse) | 85233 |
| metastases vs. no_metastases (based on metastases_at_diagnosis) | 54706 |
| Ewing_Cell_Line vs. Ewing_Tumor (based on comp.column) | 59148 |
| Ewing_Tumor vs. MSC (based on Tissue_vs_MSC) | 70237 |
| comparison | |
| differential variability measure |
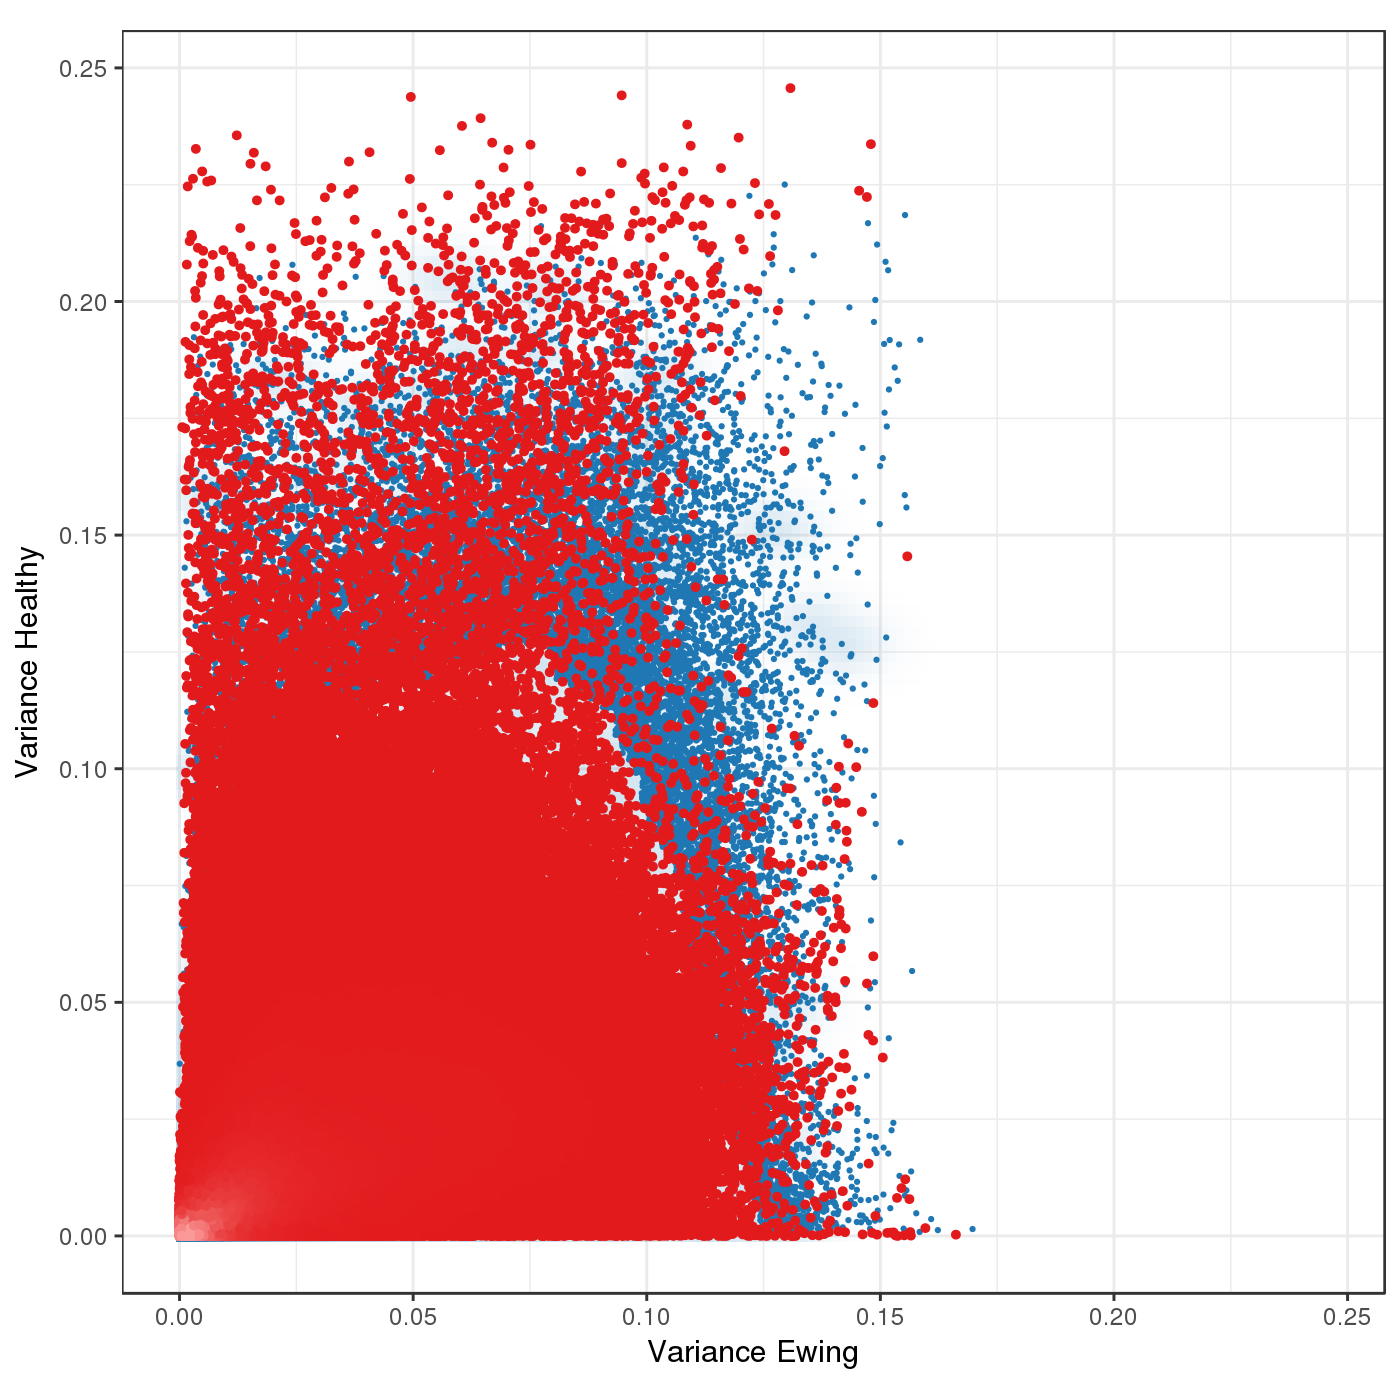
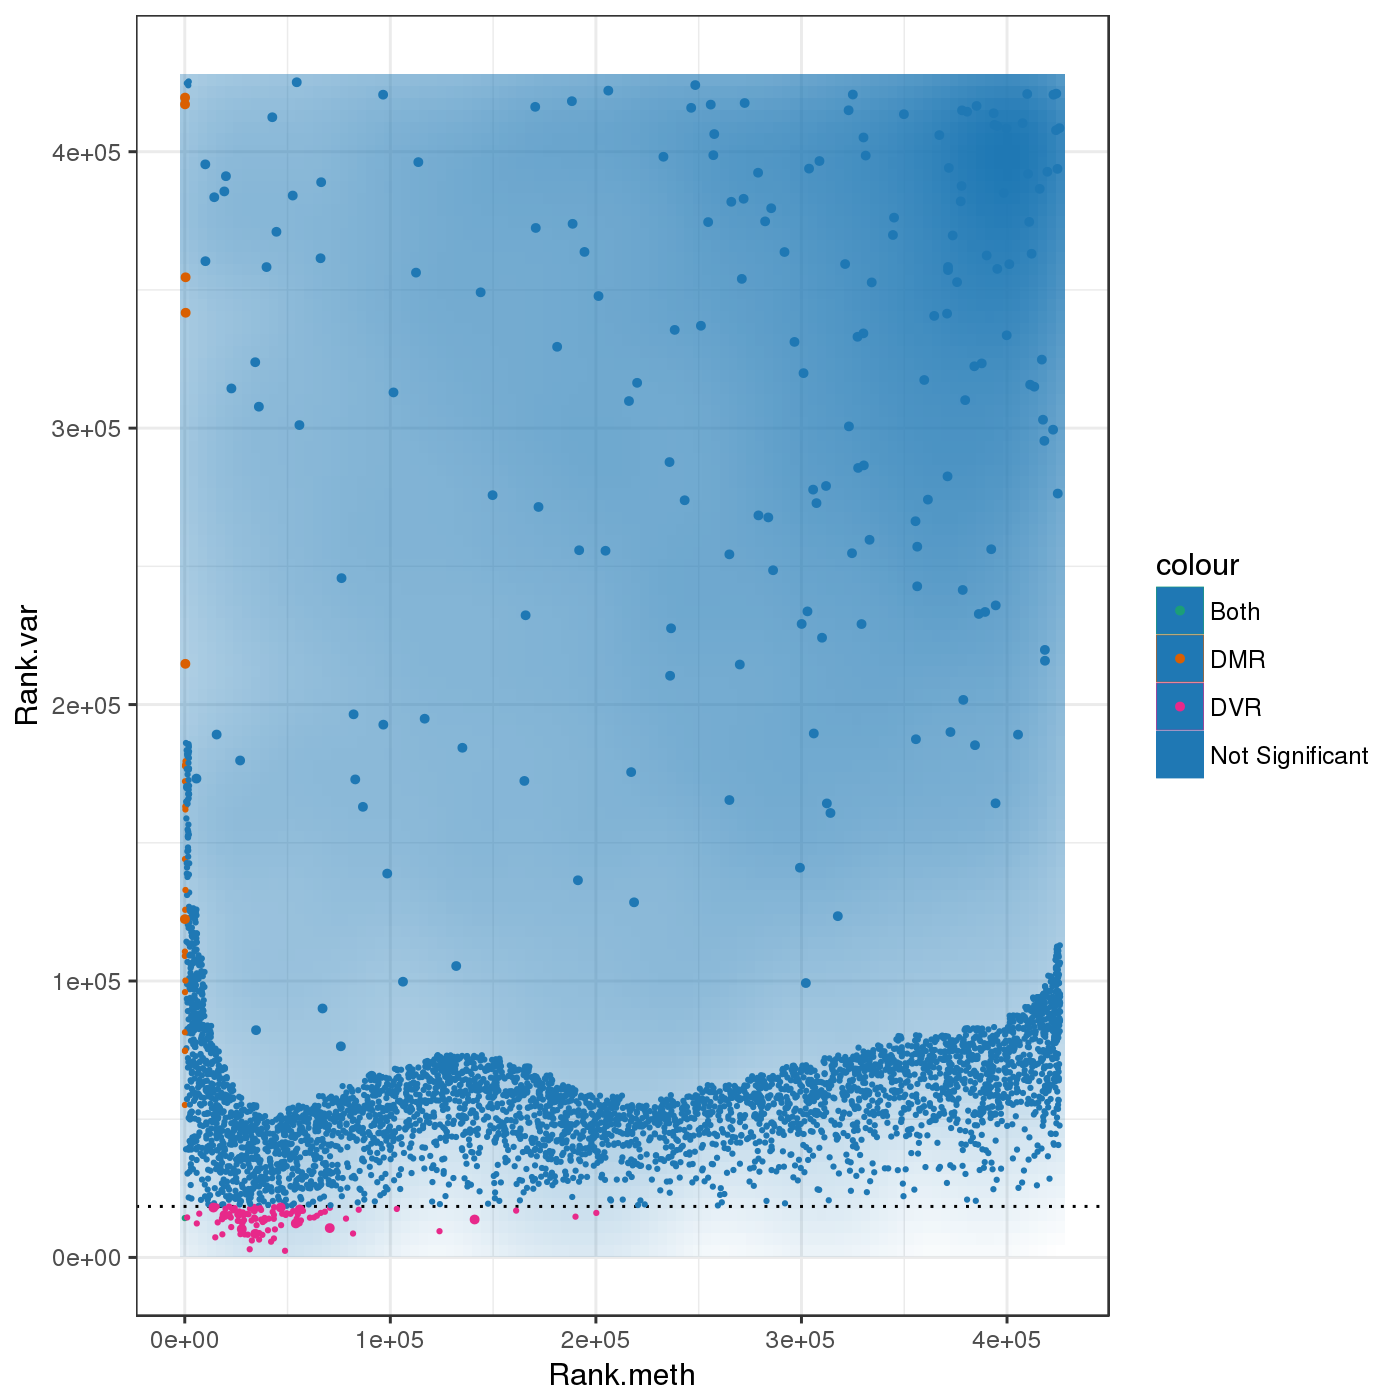
Scatterplot for differential variable sites. The transparency corresponds to point density. If the number of points exceeds 2e+06 then the number of points for density estimation is reduced to that number by random sampling. The1% of the points in the sparsest populated plot regions are drawn explicitly (up to a maximum of 10000 points). Additionally, the colored points represent differentially variable sites (according to the selected criterion).
| comparison | |
| rankCutoff |
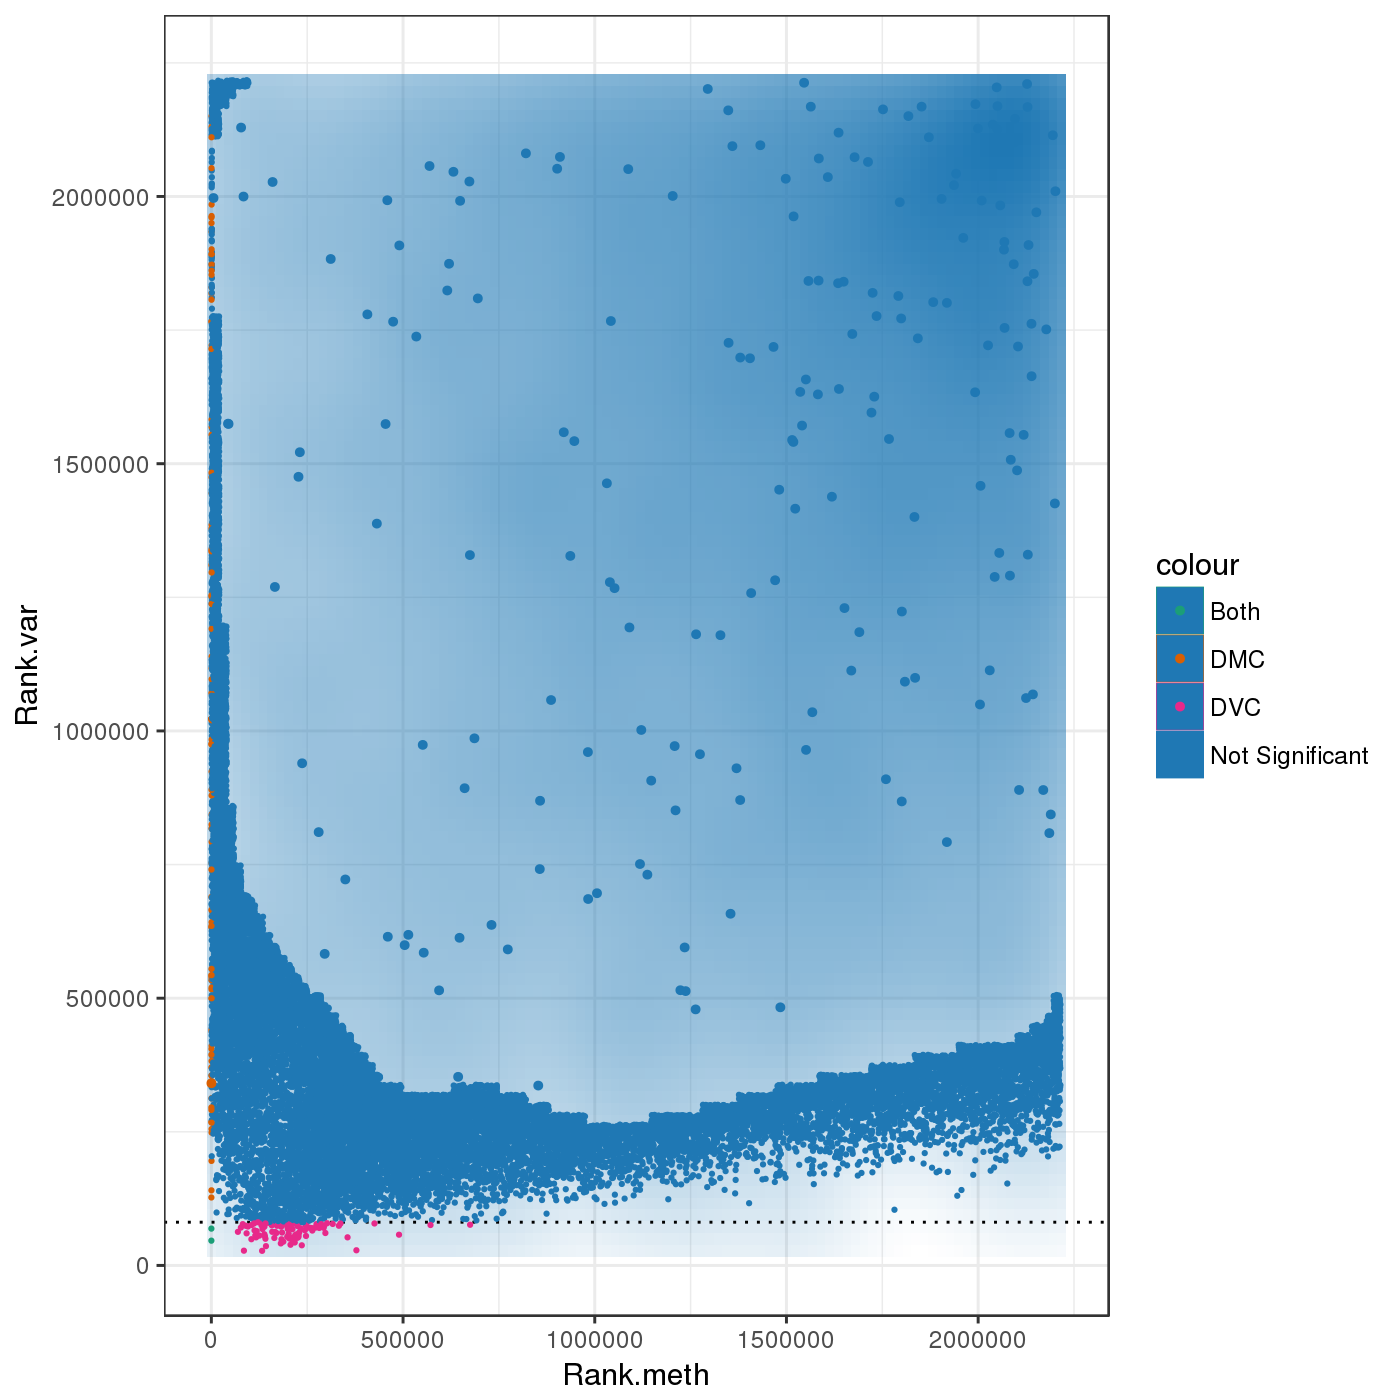
Scatterplot comparing differentially methylated (DMCs) and variable sites (DVCs), as well as sites that are both differentially methylated and variable. The dotted lines corrspond to the respective rank cutoffs used to call a site differentially methylated/variable.