Sequencing Coverage Histograms
The sequencing coverage histograms show distribution of coverage across all chromosomes. In case certain samples seem to have significantly decreased coverage, they should be excluded from the analysis.
| Sample labels |
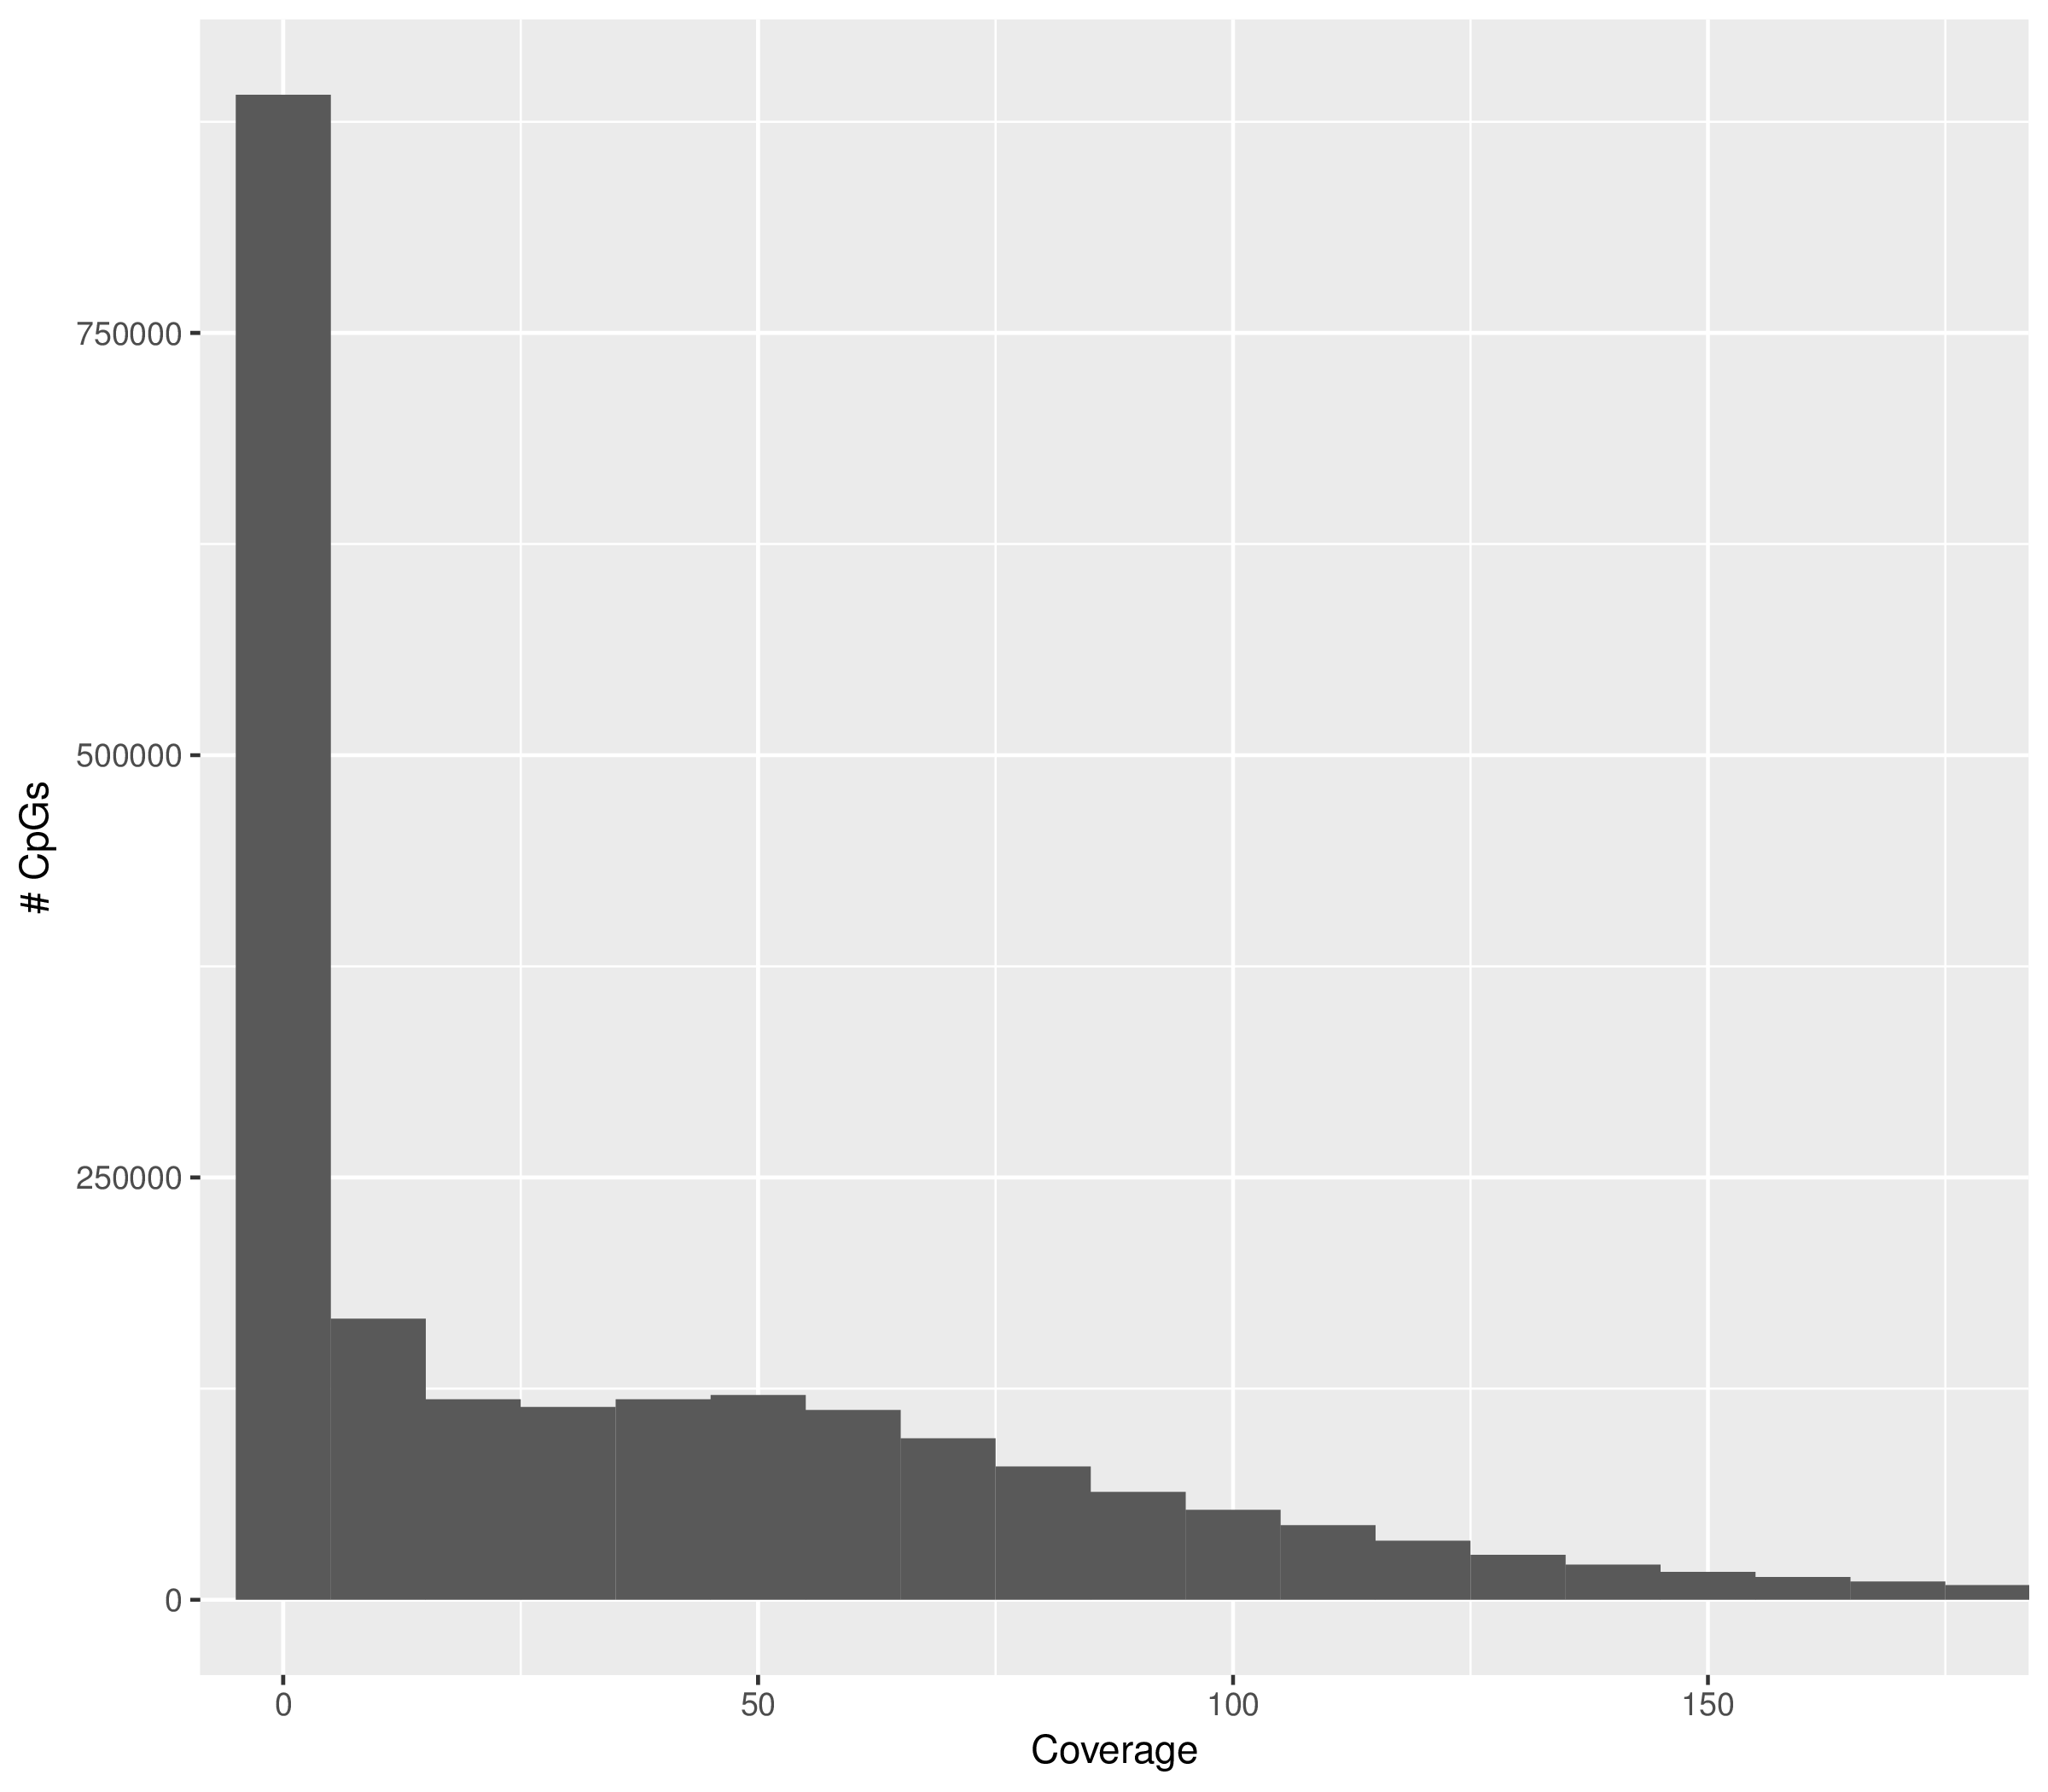
Sequencing coverage histogram visualize the bulk distribution of read coverage for each sample.
Sample coverage summary
This section contains summary metrics on the number of sites and coverage can be found in the table below. The summary table below is also available as csv file.
- sampleName: Name of the sample
- sites_num: Number of sites covered in the sample
- sites_covgMean: Mean coverage of sites in the sample
- sites_covgMedian: Median coverage of sites in the sample
- sites_covgPerc25,75: 25 and 75 percentile of coverage of sites in the sample
- sites_numCovg5,10,30,60: Number of sites with coverage greater or equal to 5,10,30,60
| sampleName | sites_num | sites_covgMean | sites_covgMedian | sites_covgPerc25 | sites_covgPerc75 | sites_numCovg5 | sites_numCovg10 | sites_numCovg30 | sites_numCovg60 | |
| HSC_1 | HSC_1 | 1535856 | 57.5259047723224 | 43 | 11 | 78 | 1280343 | 1175788 | 923969 | 568650 |
| HSC_2 | HSC_2 | 1532604 | 68.6329221377473 | 54 | 16 | 95 | 1317401 | 1227364 | 1014681 | 702208 |
| MPP1_1 | MPP1_1 | 1581165 | 89.2176945480073 | 67 | 25 | 120 | 1400278 | 1336997 | 1137055 | 852453 |
| MPP1_2 | MPP1_2 | 1550852 | 83.8858259846845 | 66 | 25 | 115 | 1369785 | 1311127 | 1119594 | 835295 |
| MPP2_1 | MPP2_1 | 1490001 | 87.0736878700081 | 69 | 25 | 119 | 1306306 | 1249451 | 1082760 | 826626 |
| MPP2_2 | MPP2_2 | 1512223 | 78.5242613027311 | 63 | 26 | 107 | 1328452 | 1274348 | 1099237 | 796986 |
| CLP_1 | CLP_1 | 1562876 | 37.6499517556095 | 31 | 13 | 52 | 1341368 | 1235318 | 808100 | 291721 |
| CLP_2 | CLP_2 | 1611935 | 31.3210743609389 | 25 | 12 | 42 | 1426570 | 1281435 | 683855 | 162366 |
| CMP_1 | CMP_1 | 1577592 | 37.4243613050776 | 30 | 13 | 52 | 1377168 | 1260443 | 811698 | 288893 |
| CMP_2 | CMP_2 | 1603981 | 35.210826063401 | 29 | 15 | 47 | 1449164 | 1333852 | 791665 | 211269 |
| GMP_1 | GMP_1 | 1548877 | 40.9901857926743 | 33 | 14 | 57 | 1339541 | 1238596 | 840261 | 347439 |
| GMP_2 | GMP_2 | 1613498 | 37.3658839366395 | 30 | 14 | 50 | 1448704 | 1327772 | 817647 | 268412 |
| MEP_1 | MEP_1 | 1574889 | 40.5756012011005 | 33 | 15 | 56 | 1375882 | 1277041 | 862262 | 347599 |
| MEP_2 | MEP_2 | 1594085 | 36.2517193248792 | 28 | 13 | 48 | 1424828 | 1289845 | 761930 | 257708 |
| CD4_1 | CD4_1 | 1574822 | 46.0499218324357 | 39 | 17 | 64 | 1385345 | 1300649 | 961509 | 455348 |
| CD4_2 | CD4_2 | 1623584 | 35.9416205136291 | 29 | 14 | 48 | 1444739 | 1332125 | 803998 | 235704 |
| CD8_1 | CD8_1 | 1569426 | 42.9913420575421 | 34 | 14 | 61 | 1384426 | 1276795 | 875617 | 405521 |
| CD8_2 | CD8_2 | 1610358 | 31.9194675966462 | 25 | 12 | 43 | 1422248 | 1280184 | 696543 | 172928 |
| B_cell_1 | B_cell_1 | 1575604 | 43.468518104803 | 35 | 16 | 60 | 1390870 | 1296874 | 895373 | 404242 |
| B_cell_2 | B_cell_2 | 1607899 | 32.4855858483649 | 26 | 13 | 43 | 1430493 | 1297723 | 717193 | 170611 |
| Eryth_1 | Eryth_1 | 1406335 | 19.0826979347026 | 14 | 8 | 23 | 1204687 | 954506 | 190550 | 16582 |
| Eryth_2 | Eryth_2 | 1330606 | 10.3067782649409 | 7 | 3 | 12 | 882078 | 455716 | 25135 | 8311 |
| Gran_1 | Gran_1 | 1539858 | 39.2877583517441 | 32 | 14 | 54 | 1346317 | 1238434 | 814076 | 318033 |
| Gran_2 | Gran_2 | 1622256 | 34.4561943367755 | 27 | 12 | 46 | 1414249 | 1274946 | 755528 | 227715 |
| Mono_1 | Mono_1 | 1399328 | 17.8618501166274 | 13 | 7 | 21 | 1176040 | 908853 | 149869 | 13525 |
| Mono_2 | Mono_2 | 1372262 | 13.8322361181757 | 10 | 5 | 16 | 1065614 | 712164 | 58746 | 9402 |
| TBSC_1 | TBSC_1 | 1580873 | 35.4797140567269 | 28 | 11 | 48 | 1345896 | 1216370 | 748313 | 254519 |
| TBSC_2 | TBSC_2 | 1606950 | 33.9599427486854 | 27 | 12 | 46 | 1393209 | 1267541 | 737474 | 216264 |
| ABSC_1 | ABSC_1 | 1624711 | 36.0977152244307 | 30 | 13 | 49 | 1409721 | 1290560 | 818882 | 249918 |
| ABSC_2 | ABSC_2 | 1644275 | 38.724770491554 | 32 | 15 | 52 | 1441504 | 1337680 | 879293 | 300491 |
| MTAC_1 | MTAC_1 | 1630972 | 33.4264781982768 | 27 | 11 | 46 | 1396249 | 1257090 | 752267 | 215574 |
| MTAC_2 | MTAC_2 | 1562432 | 34.7196991613075 | 26 | 11 | 46 | 1343806 | 1206861 | 710463 | 234959 |
| CLDC_1 | CLDC_1 | 1458590 | 36.1711803865377 | 29 | 16 | 45 | 1396450 | 1285567 | 716330 | 166227 |
| CLDC_2 | CLDC_2 | 1460510 | 38.2765958466563 | 30 | 17 | 47 | 1399319 | 1294528 | 749708 | 200648 |
| EPro_1 | EPro_1 | 1458355 | 35.8104309307405 | 29 | 16 | 44 | 1395576 | 1286883 | 701299 | 151840 |
| EPro_2 | EPro_2 | 1458263 | 34.303527552986 | 28 | 16 | 43 | 1391345 | 1273756 | 680853 | 132717 |
| EDif_1 | EDif_1 | 1463954 | 44.5133931803868 | 36 | 21 | 54 | 1419485 | 1346405 | 895871 | 285642 |
| EDif_2 | EDif_2 | 1460069 | 39.1663298104405 | 32 | 17 | 49 | 1396349 | 1292322 | 785354 | 218974 |
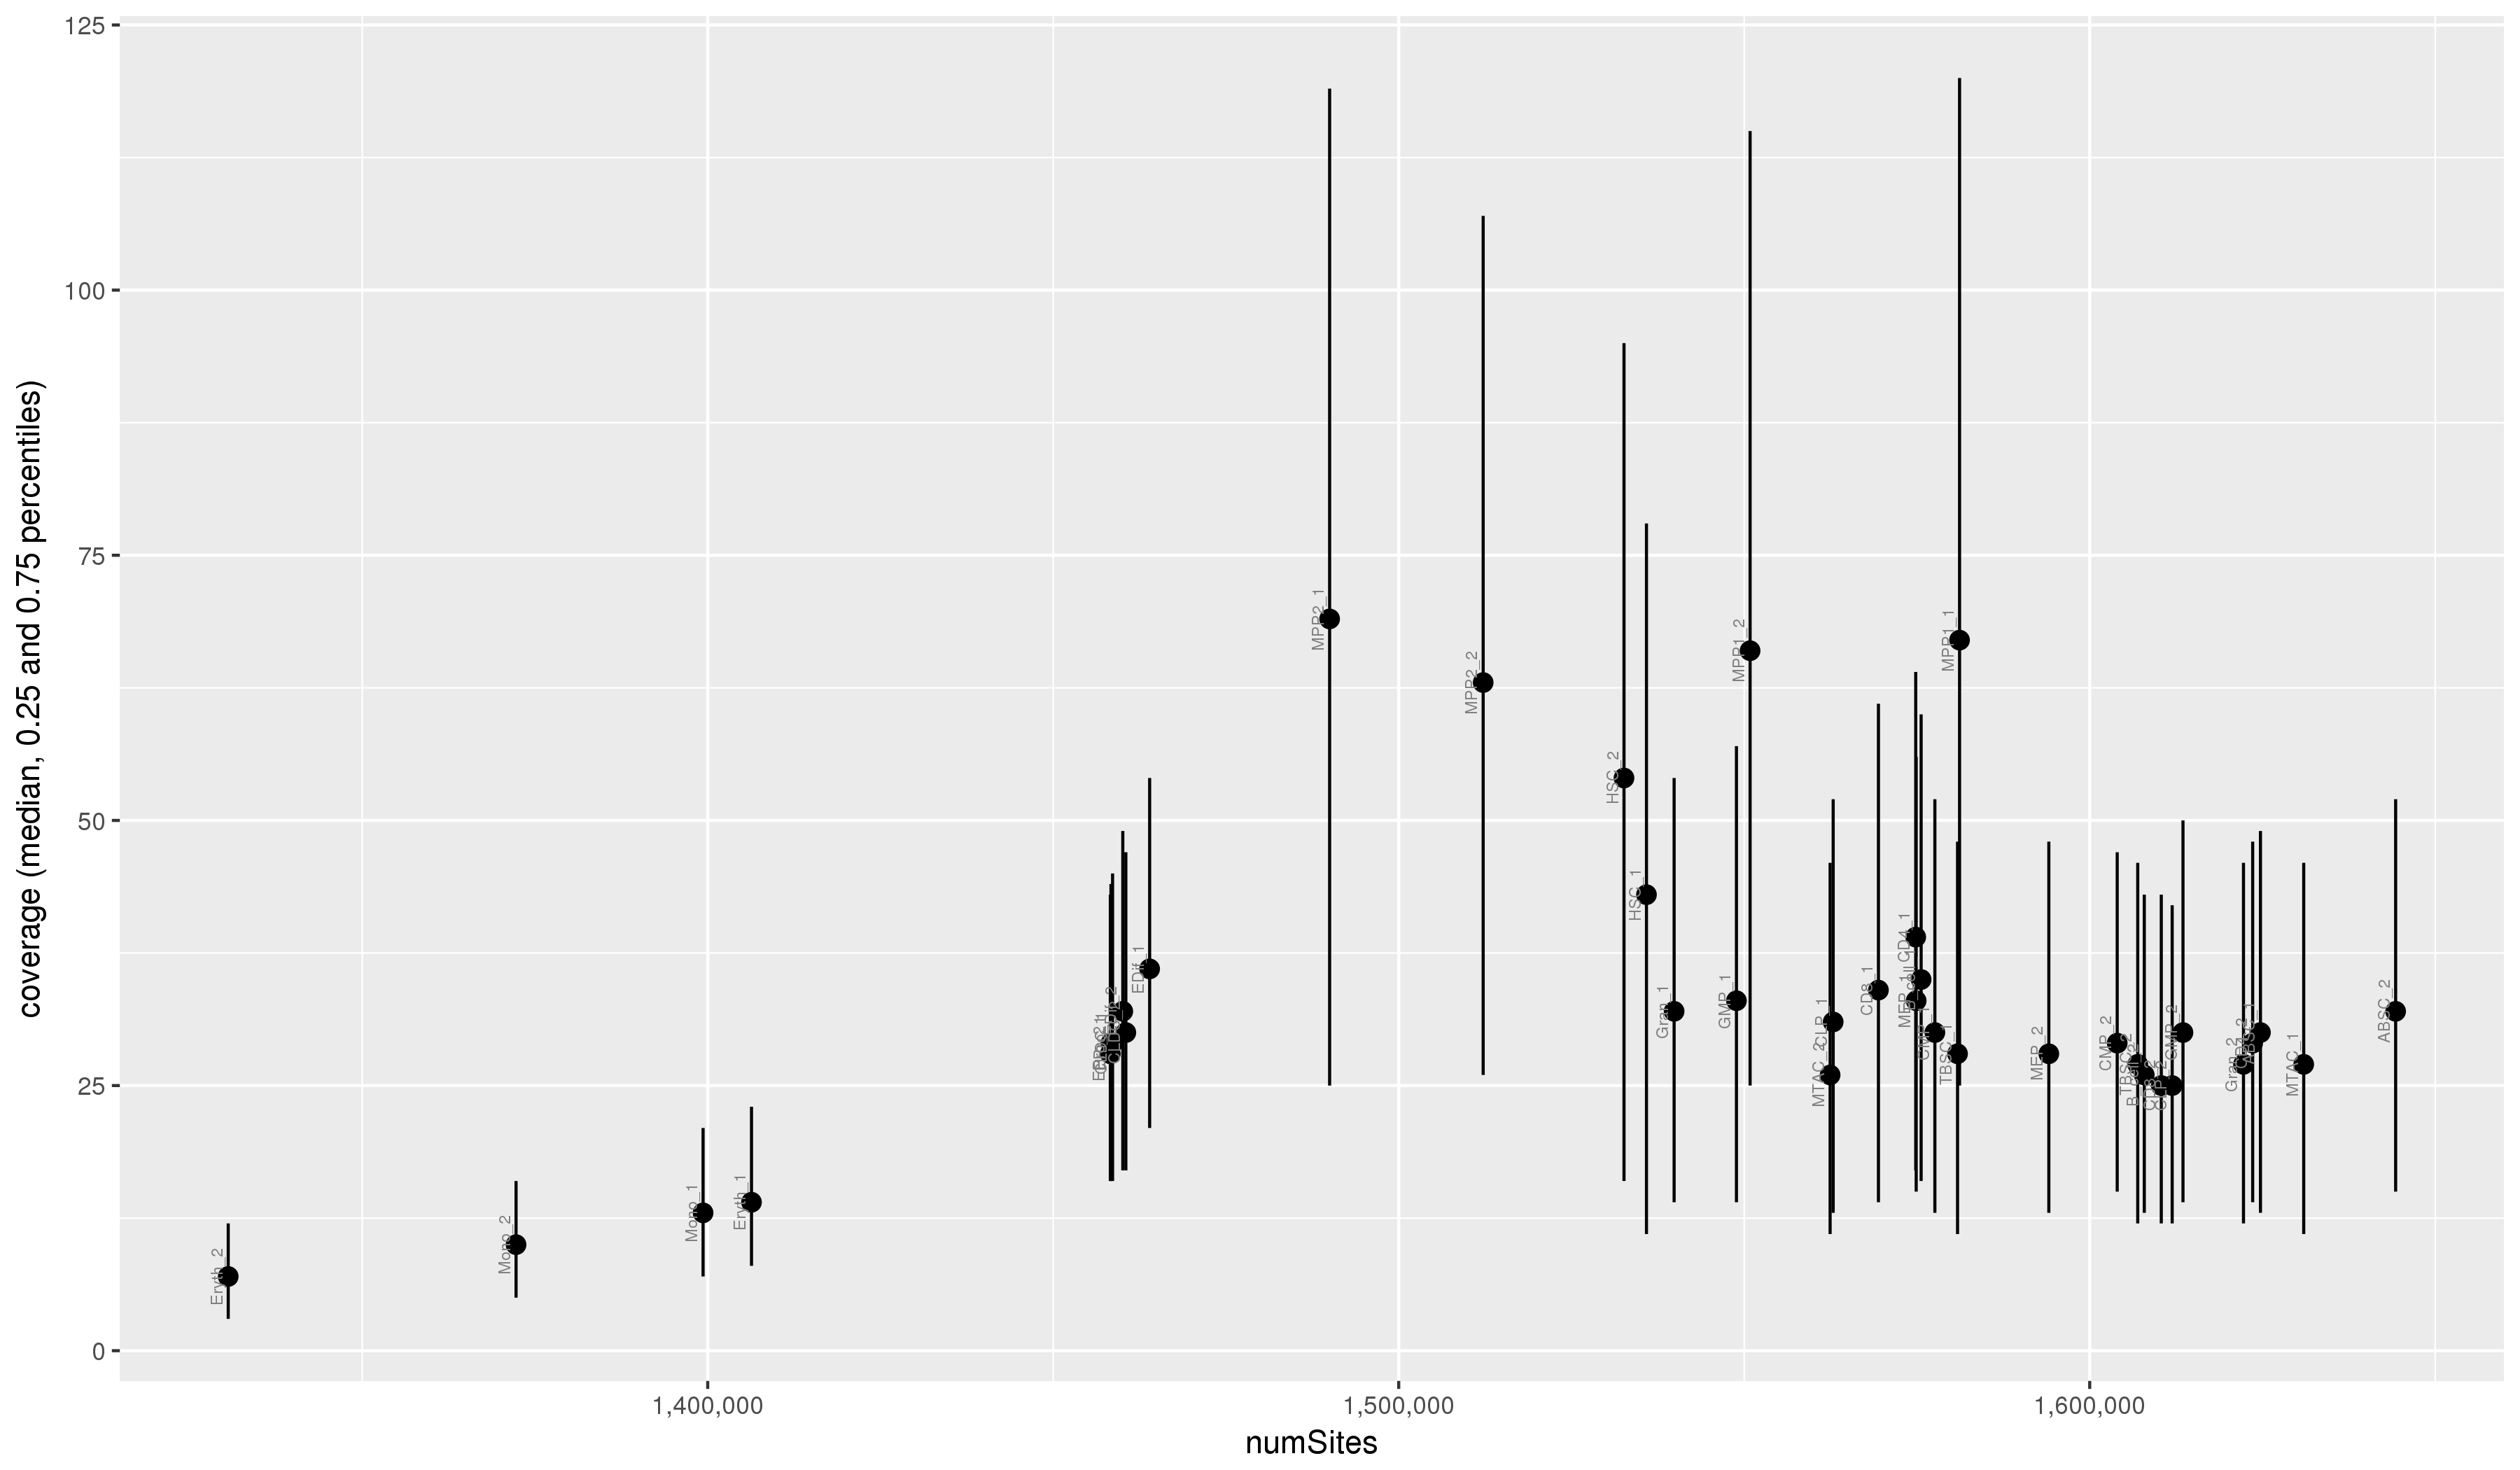
Covered sites and median coverages for each sample. Vertical bars depict the inter-quartile range.
Sequencing Coverage Violin Plots
The plots below show an alternative approach to visualizing the coverage distribution.
| Sample chunk |
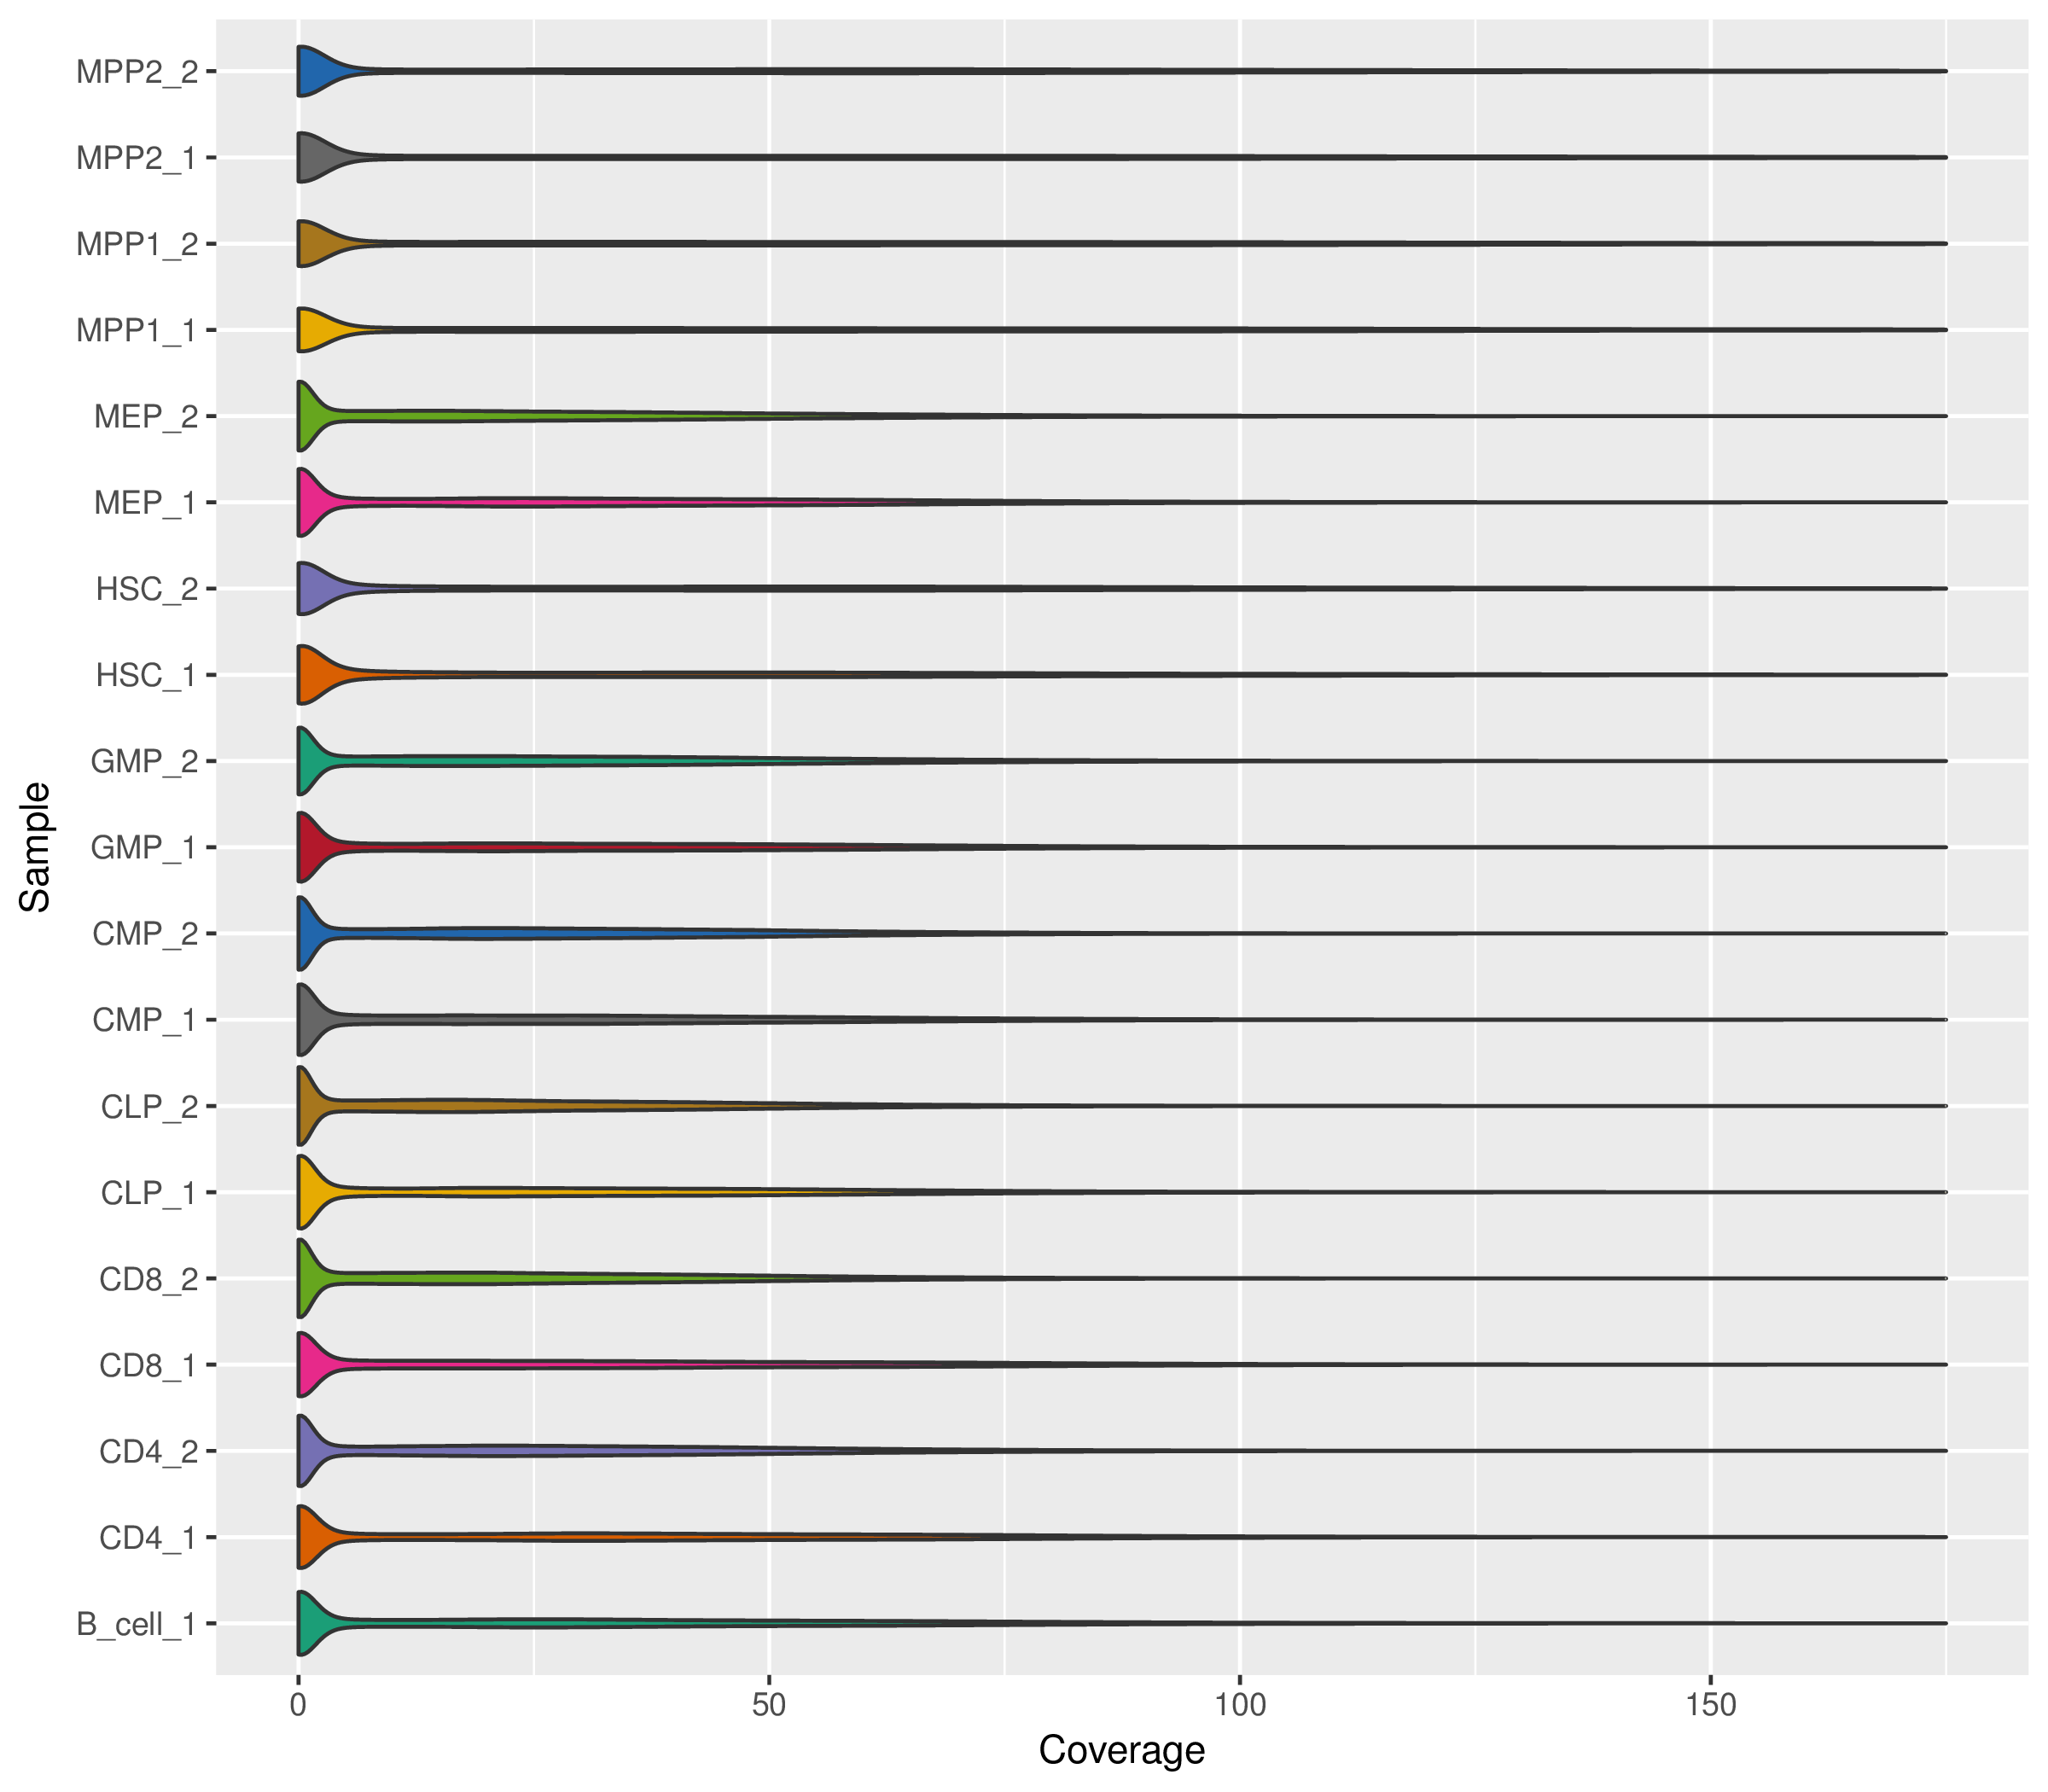
Sequencing coverage histogram visualized as violin plots. Distributions are based on 2145307 methylation sites.
Sequencing Coverage Thresholds
In total, between 0.4 and 1.1 million sites are covered in all samples of the dataset. The figure below shows the change in supports for different coverage thresholds. The exact values are available in a dedicated comma-separated file accompanying this report.
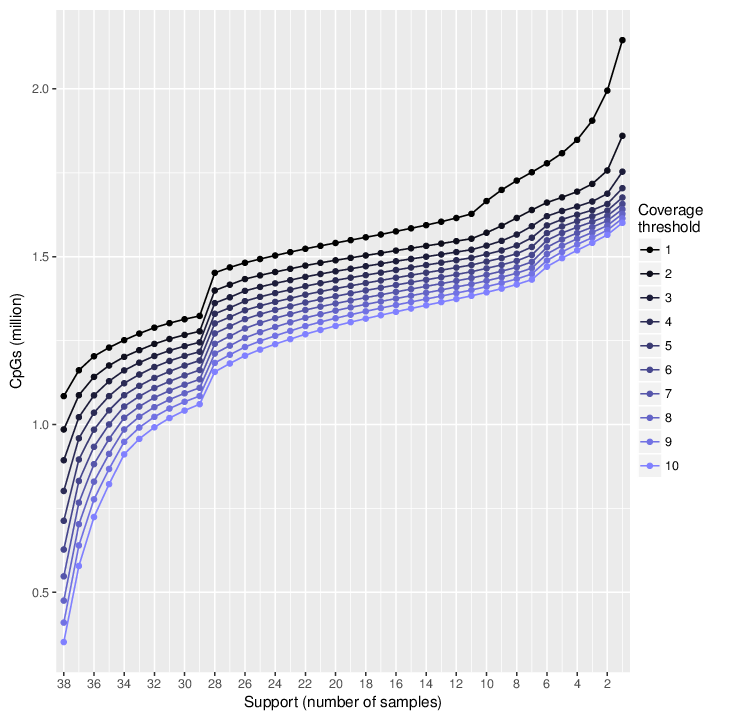
Line plot showing the number of CpG sites with a given support for different thresholds of minimal coverage. The support of a CpG site is the minimal number of samples that interrogate it.