Covariate Inference

Age Prediction

Plots for the visualization of predicted ages based on the DNA methylation pattern.

A predefined predictor was used and is available as a comma-separated file.

There was no age annotation available for the data set, therefore no inference based on age prediction could be done.

Figure 1

Open PDF Figure 1

Age distributions of the predicted ages by the age prediction algorithm.

Immune Cell Content Estimation

Immune cell content estimation was performed using the LUMP algorithm [1]. Estimates are values between 0 and 1 and are based on up to 44 sites per sample. The figure below shows the distribution of immune cell content values.

Figure 2

Open PDF Figure 2

Histogram of all 12 estimates obtained after runnin LUMP.

Estimation of Cell Type Heterogeneity Effects

Reference methylomes

The dataset contained reference methylomes defined by the sample annotation column CellType. Detected reference methylomes were are summarized in the table below.

Cell type Number of samples
CT1 2
CT2 2

Cell type contributions

The contributions of cell types were estimated using the method by Houseman et al [2].

Selection of the cell type markers

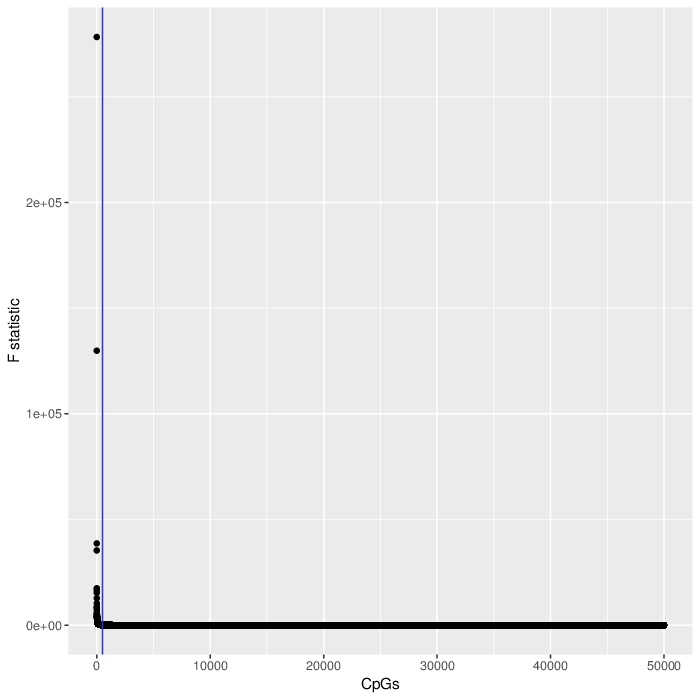
In the first step the reference methylomes were used to estimate the association of each CpG position to each of the cell types. The stength of association was measured using F-test. To decrease the computation load, only 50000 most variable CpGs were considered. Finally, only 500 CpGs with the lowest F-test p-value were used in the contribution estimation. The plot below visualizes the distribution of F statistic values for all tested CpGs. Note that selecting the most informative CpGs is equivalent to applying an F statistic cut-off of 83.6.

Figure 3

Open PDF Figure 3

Scatter plot visualizing the F statistic of the cell type association model for each CpG position from the tested subset. The vertical blue line, if present, reflects the selection of 500 best markers for the projection.

Cell type contributions via the coefficient projection

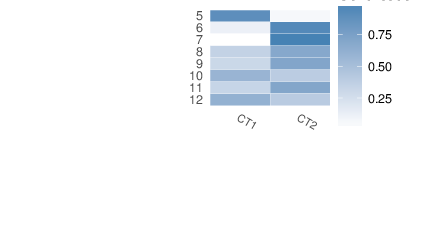
After the marker selection, a projection of the target data onto the space of the marker selection model coefficients yields contributions of each reference cell type to each measured DNA methylation profile. The resulting cell type contributions are available in a dedicated comma-separated file accompanying this report. These values are also displayed in the heatmap below. The contributions are constrained to be greater or equal to zero, and the per-sample sums are expected to be close to one, i.e. they are estimates of the cell type proportions. Per-sample totals much larger than one may indicate the problems with the procedure, e.g. bad correspondence of the target data to the reference methylomes, significant batch effects etc.

Figure 4

Open PDF Figure 4

Heatmap visualizing estimated cell type contributions, scaled to the range [0, 1].

References

  1. Aran, D. et al. (2015) Systematic pan-cancer analysis of tumour purity. Nature Communications 6:8971.
  2. Houseman, E. (2012) DNA methylation arrays as surrogate measures of cell mixture distribution. BMC Bioinformatics, 13(86)