Differential Methylation

Introduction: Differential Methylation of Sample Groups

Differential methylation analysis was conducted on site and region level according to the sample groups specified in the analysis.

Comparisons

The following comparisons were made:

The table below summarizes information on the comparisons.

comparison adjustment covariateTable
1 young vs. senior (based on Age Group) Genome-wide methylation,Gender,ct_1,ct_2,ct_3,ct_4,ct_5,ct_6 csv

P-values

In the following anlyses, p-values on the site level were computed using the limma method. I.e. hierarchical linear models from the limma package were employed and fitted using an empirical Bayes approach on derived M-values.

Site Level

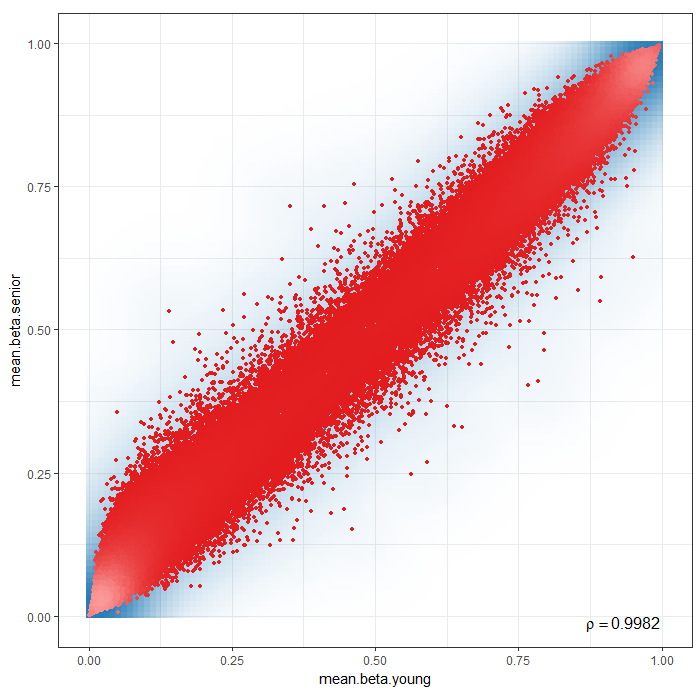
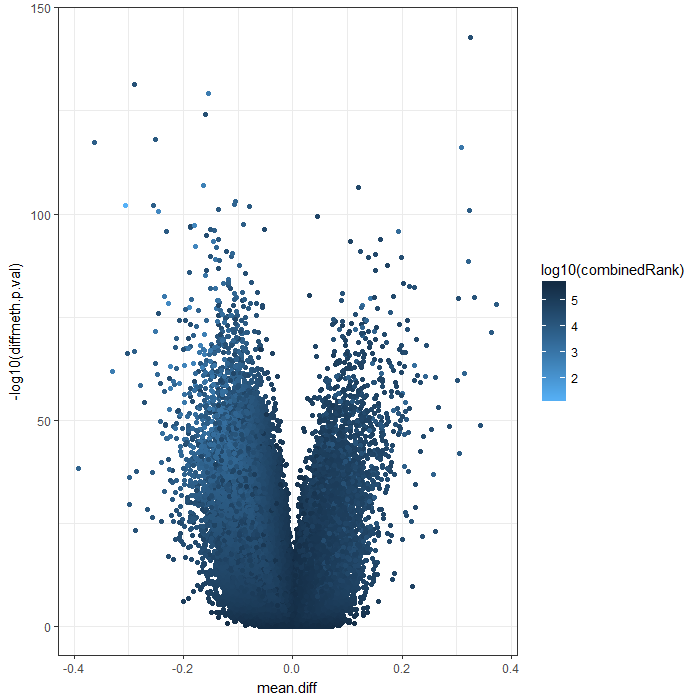
Differential methylation on the site level was computed based on a variety of metrics. Of particular interest for the following plots and analyses are the following quantities for each site: a) the difference in mean methylation levels of the two groups being compared, b) the quotient in mean methylation and c) a statistical test (limma or t-test depending on the settings) assessing whether the methylation values in the two groups originate from distinct distributions. Additionally each site was assigned a rank based on each of these three criteria. A combined rank is computed as the maximum (i.e. worst) rank among the three ranks. The smaller the combined rank for a site, the more evidence for differential methylation it exhibits. This section includes scatterplots of the site group means as well as volcano plots of each pairwise comparison colored according to the combined ranks or p-values of a given site.

The following rank cutfoffs have been automatically selected for the analysis of differentially methylated sites:

Rank Cutoff
young vs. senior (based on Age Group) 59023
comparison
differential methylation measure

Figure 1

Figure 1

Scatterplot for differential methylation (sites). If the selected criterion is not rankGradient: The transparency corresponds to point density. If the number of points exceeds 2e+06 then the number of points for density estimation is reduced to that number by random sampling.The1% of the points in the sparsest populated plot regions are drawn explicitly (up to a maximum of 10000 points).Additionally, the colored points represent differentially methylated sites (according to the selected criterion). If the selected criterion is rankGradient: median combined ranks accross hexagonal bins are shown as a gradient according to the color legend.

comparison
difference metric
significance metric

Figure 2

Figure 2

Volcano plot for differential methylation quantified by various metrics. Color scale according to combined ranking.

Differential Methylation Tables

A tabular overview of measures for differential methylation on the site level for the individual comparisons are provided in this section. Below, a brief explanation of the different columns can be found:

The tables for the individual comparisons can be found here:

Differential Variability

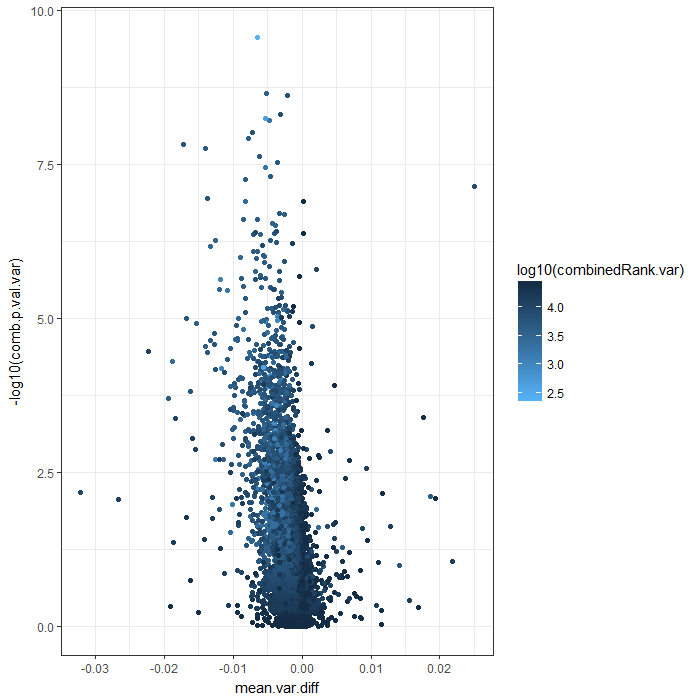
Differentially variable sites were computed with diffVar. For more information about the method, have a look at the missMethyl Bioconductor package.[1] This section contains plots and tables describing the results of this test and further analyses of the sites that were selected as differentially variable. Please note that missing methylation values have been imputed with knn.

The following rank cutoffs have been automatically selected for the analysis of differentially variable sites:

Rank Cutoff
young vs. senior (based on Age Group) 22582
comparison
differential variability measure

Figure 3

Figure 3

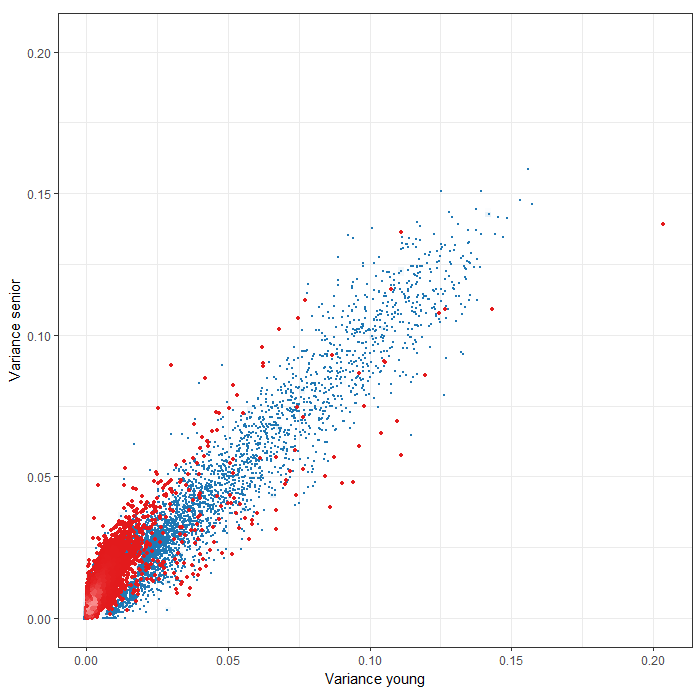
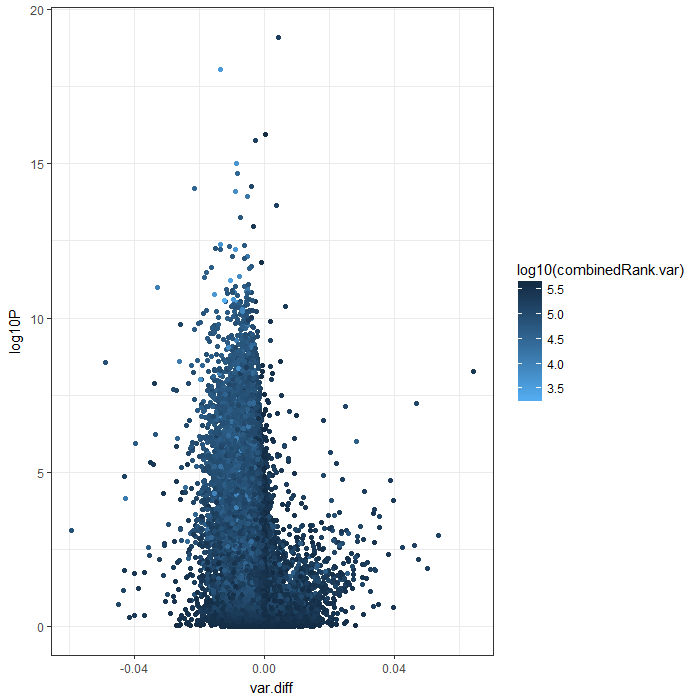
Scatterplot for differential variable sites. The transparency corresponds to point density. If the number of points exceeds 2e+06 then the number of points for density estimation is reduced to that number by random sampling. The1% of the points in the sparsest populated plot regions are drawn explicitly (up to a maximum of 10000 points). Additionally, the colored points represent differentially variable sites (according to the selected criterion).
comparison
significance metric

Figure 4

Figure 4

Volcano plot for differential variable sites.

comparison
rankCutoff

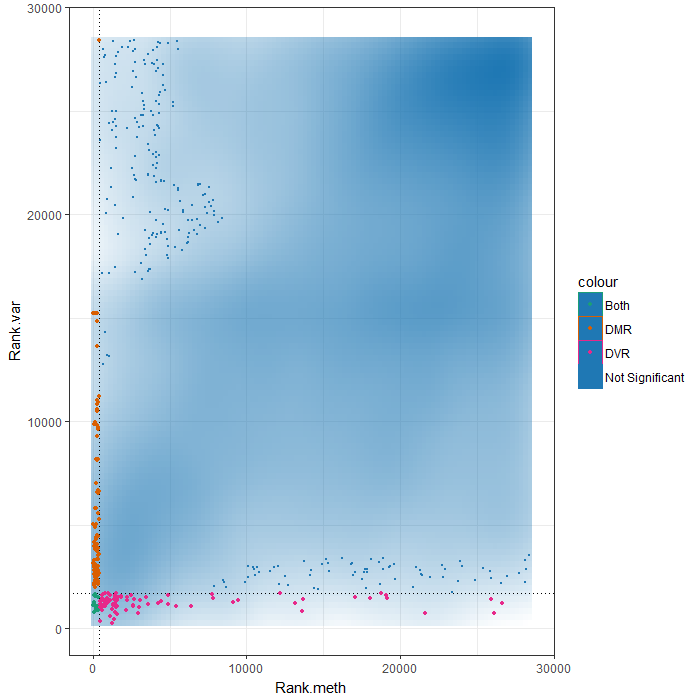
Figure 5

Figure 5

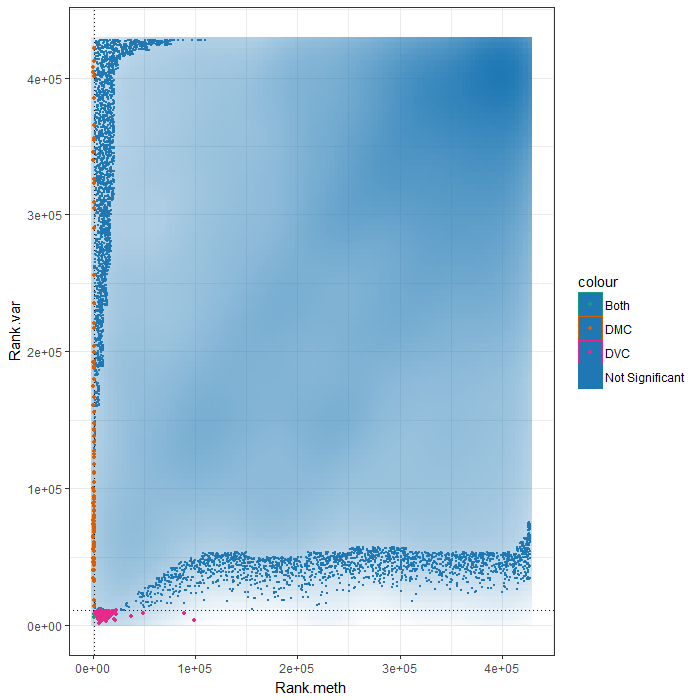
Scatterplot comparing differentially methylated (DMCs) and variable sites (DVCs), as well as sites that are both differentially methylated and variable. The dotted lines corrspond to the respective rank cutoffs used to call a site differentially methylated/variable.

Region Level

Differential methylation on the region level was computed based on a variety of metrics. Of particular interest for the following plots and analyses are the following quantities for each region: the mean difference in means across all sites in a region of the two groups being compared and the mean of quotients in mean methylation as well as a combined p-value calculated from all site p-values in the region [2]. Additionally each region was assigned a rank based on each of these three criteria. A combined rank is computed as the maximum (i.e. worst) value among the three ranks. The smaller the combined rank for a region, the more evidence for differential methylation it exhibits. Regions were defined based on the region types specified in the analysis. This section includes scatterplots of the region group means as well as volcano plots of each pairwise comparison colored according to the combined rank of a given region.

The following rank cutfoffs have been automatically selected for the analysis of differentially methylated regions:

promoters
young vs. senior (based on Age Group) 996
comparison
regions
differential methylation measure

Figure 6

Figure 6

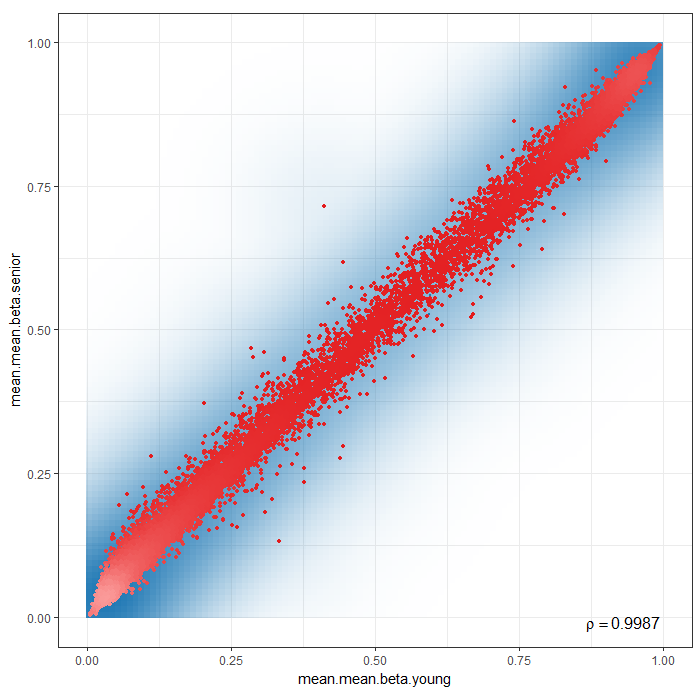
Scatterplot for differential methylation (regions). If the selected criterion is not rankGradient: The transparency corresponds to point density. The 1% of the points in the sparsest populated plot regions are drawn explicitly. Additionally, the colored points represent differentially methylated regions (according to the selected criterion). If the selected criterion is rankGradient: median combined ranks accross hexagonal bins are shown as a gradient according to the color legend.
comparison
regions
difference metric
significance metric

Figure 7

Figure 7

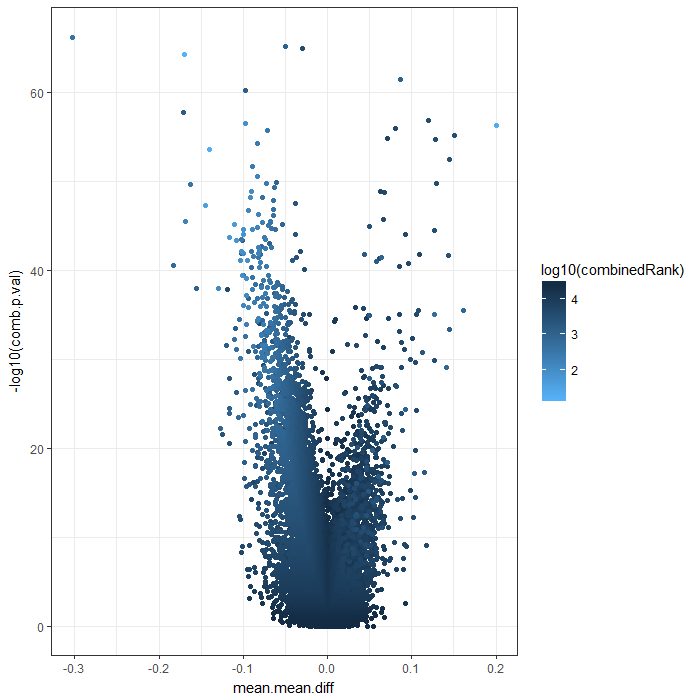
Volcano plot for differential methylation quantified by various metrics. Color scale according to combined ranking.

Differential Methylation Tables

A tabular overview of measures for differential methylation on the region level for the individual comparisons are provided in this section.

The tables for the individual comparisons can be found here:

promoters
young vs. senior (based on Age Group) csv

Differential Variability

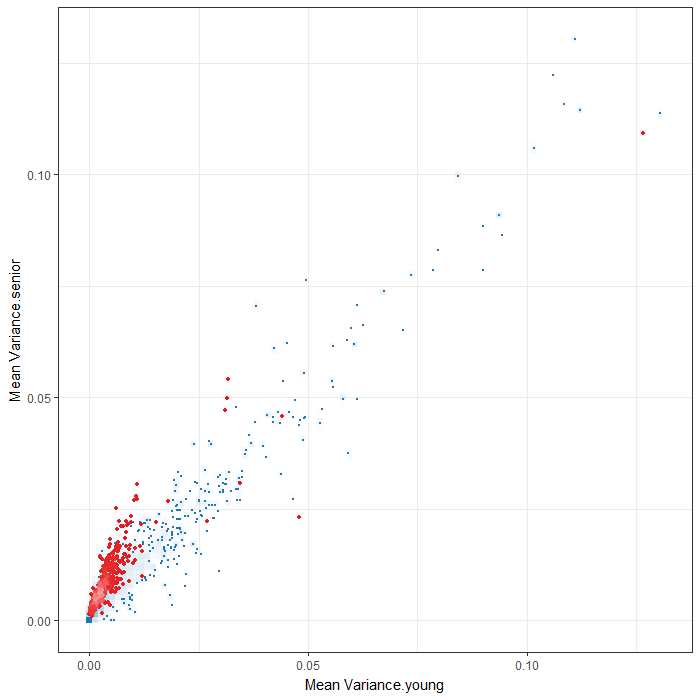
Differential variability on the region level was computed similar to differential methylation, but the mean of variances, the log-ratio of the quotient of variances as well as the p-values from the differentiality test were employed. Ranking was performed in line with the ranking of differential methylation.

The following rank cutoffs have been automatically selected for the analysis of differentially variable regions:

promoters
young vs. senior (based on Age Group) 2340
comparison
regions
differential variability measure

Figure 8

Figure 8

Scatterplot for differential variable regions. The transparency corresponds to point density. The 1% of the points in the sparsest populated plot regions are drawn explicitly. Additionally, the colored points represent differentially methylated regions (according to the selected criterion).
comparison
regions
difference metric
significance metric

Figure 9

Figure 9

Volcano plot for differential variability quantified by various metrics. Color scale according to combined ranking.

comparison
regions
rankCutoff

Figure 10

Figure 10

Scatterplot comparing differentially methylated (DMRs) and variable regions (DVRs), as well as regions that are both differentially methylated and variable. The dotted lines corrspond to the respective rank cutoffs used to call a region differentially methylated/variable.

GO Enrichment Analysis

GO Enrichment Analysis was conducted. The wordclouds and tables below contains significant GO terms as determined by a hypergeometric test.

comparison
Hypermethylation/hypomethylation
ontology
regions
differential methylation measure

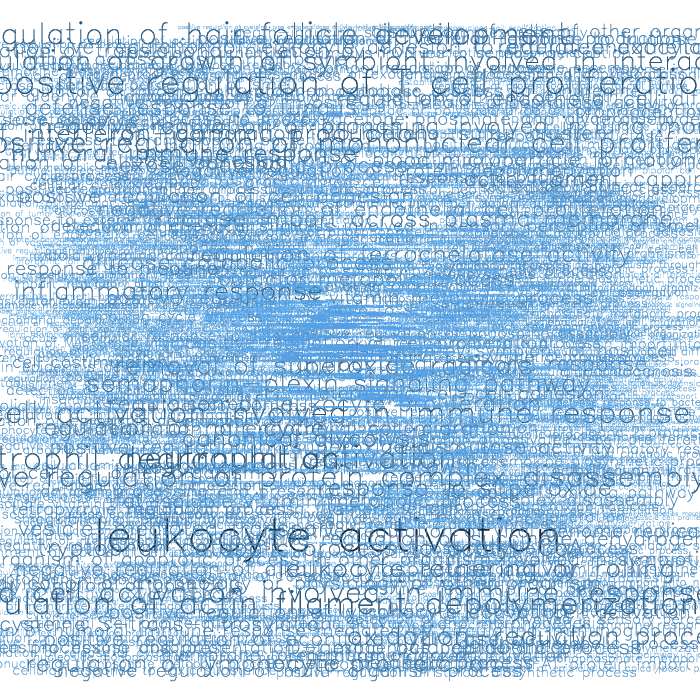
Figure 11

Figure 11

Wordclouds for GO enrichment terms.

comparison
Hypermethylation/hypomethylation
ontology
regions
differential methylation measure

GOMFID Pvalue OddsRatio ExpCount Count Size Term
GO:0045321 0 5.1253 3.2746 13 1027 leukocyte activation
GO:0042102 2e-04 15.4112 0.2933 4 92 positive regulation of T cell proliferation
GO:0043312 4e-04 5.9004 1.3679 7 429 neutrophil degranulation
GO:0030834 4e-04 23.1984 0.1467 3 46 regulation of actin filament depolymerization
GO:0042119 4e-04 5.7598 1.3998 7 439 neutrophil activation
GO:1903039 5e-04 8.6963 0.6473 5 203 positive regulation of leukocyte cell-cell adhesion
GO:0002263 6e-04 4.8696 1.9131 8 600 cell activation involved in immune response
GO:0051798 6e-04 65.2 0.0383 2 12 positive regulation of hair follicle development
GO:0032946 7e-04 11.0909 0.4018 4 126 positive regulation of mononuclear cell proliferation
GO:0043242 7e-04 19.1718 0.1754 3 55 negative regulation of protein complex disassembly
GO:0002275 7e-04 5.292 1.5177 7 476 myeloid cell activation involved in immune response
GO:0002444 8e-04 5.2343 1.5337 7 481 myeloid leukocyte mediated immunity
GO:0046365 8e-04 18.1224 0.1849 3 58 monosaccharide catabolic process
GO:0044130 9e-04 54.3261 0.0446 2 14 negative regulation of growth of symbiont in host
GO:0034341 0.0012 9.5841 0.4623 4 145 response to interferon-gamma
GO:0044144 0.0012 46.559 0.051 2 16 modulation of growth of symbiont involved in interaction with host
GO:0044110 0.0015 40.7337 0.0574 2 18 growth involved in symbiotic interaction
GO:0055114 0.0015 3.7865 2.7772 9 871 oxidation-reduction process
GO:0050901 0.0016 38.335 0.0606 2 19 leukocyte tethering or rolling
GO:0032649 0.0018 13.6374 0.2423 3 76 regulation of interferon-gamma production
GO:0002544 0.0018 36.2029 0.0638 2 20 chronic inflammatory response
GO:0019430 0.0018 36.2029 0.0638 2 20 removal of superoxide radicals
GO:0071526 0.0018 36.2029 0.0638 2 20 semaphorin-plexin signaling pathway
GO:0060333 0.0021 12.9255 0.2551 3 80 interferon-gamma-mediated signaling pathway
GO:0009110 0.0022 32.5783 0.0701 2 22 vitamin biosynthetic process
GO:0071450 0.0022 32.5783 0.0701 2 22 cellular response to oxygen radical
GO:0051261 0.0023 12.4383 0.2646 3 83 protein depolymerization
GO:0006959 0.0024 7.7945 0.5644 4 177 humoral immune response
GO:0006779 0.0024 31.0248 0.0733 2 23 porphyrin-containing compound biosynthetic process
GO:0061621 0.0026 29.6126 0.0765 2 24 canonical glycolysis
GO:0000303 0.0029 28.3233 0.0797 2 25 response to superoxide
GO:0061615 0.0029 28.3233 0.0797 2 25 glycolytic process through fructose-6-phosphate
GO:0050670 0.0029 7.4046 0.5931 4 186 regulation of lymphocyte proliferation
GO:0042634 0.0031 27.1413 0.0829 2 26 regulation of hair cycle
GO:0002149 0.0032 Inf 0.0032 1 1 hypochlorous acid biosynthetic process
GO:0010722 0.0032 Inf 0.0032 1 1 regulation of ferrochelatase activity
GO:0019442 0.0032 Inf 0.0032 1 1 tryptophan catabolic process to acetyl-CoA
GO:0035238 0.0032 Inf 0.0032 1 1 vitamin A biosynthetic process
GO:0061048 0.0032 Inf 0.0032 1 1 negative regulation of branching involved in lung morphogenesis
GO:1901810 0.0032 Inf 0.0032 1 1 beta-carotene metabolic process
GO:1990268 0.0032 Inf 0.0032 1 1 response to gold nanoparticle
GO:1990539 0.0032 Inf 0.0032 1 1 fructose import across plasma membrane
GO:0070663 0.0035 6.9774 0.6281 4 197 regulation of leukocyte proliferation
GO:0006007 0.0038 24.1208 0.0925 2 29 glucose catabolic process
GO:0050832 0.0041 23.2578 0.0957 2 30 defense response to fungus
GO:0045055 0.0042 3.8199 2.0694 7 649 regulated exocytosis
GO:0016192 0.0044 2.7429 5.2228 12 1638 vesicle-mediated transport
GO:0019318 0.0045 6.4993 0.6728 4 211 hexose metabolic process
GO:0045926 0.0045 6.4993 0.6728 4 211 negative regulation of growth
GO:0051693 0.0049 21.0028 0.1052 2 33 actin filament capping
GO:0019731 0.0052 20.3451 0.1084 2 34 antibacterial humoral response
GO:0045601 0.0052 20.3451 0.1084 2 34 regulation of endothelial cell differentiation
GO:0045785 0.0053 4.8549 1.1351 5 356 positive regulation of cell adhesion
GO:0001937 0.0055 19.7273 0.1116 2 35 negative regulation of endothelial cell proliferation
GO:0006734 0.0059 19.1458 0.1148 2 36 NADH metabolic process
GO:0002876 0.0064 319.2553 0.0064 1 2 positive regulation of chronic inflammatory response to antigenic stimulus
GO:0010693 0.0064 319.2553 0.0064 1 2 negative regulation of alkaline phosphatase activity
GO:0015755 0.0064 319.2553 0.0064 1 2 fructose transport
GO:0018283 0.0064 319.2553 0.0064 1 2 iron incorporation into metallo-sulfur cluster
GO:0019478 0.0064 319.2553 0.0064 1 2 D-amino acid catabolic process
GO:0035606 0.0064 319.2553 0.0064 1 2 peptidyl-cysteine S-trans-nitrosylation
GO:0045994 0.0064 319.2553 0.0064 1 2 positive regulation of translational initiation by iron
GO:1901671 0.0064 319.2553 0.0064 1 2 positive regulation of superoxide dismutase activity
GO:1904231 0.0064 319.2553 0.0064 1 2 positive regulation of succinate dehydrogenase activity
GO:1904234 0.0064 319.2553 0.0064 1 2 positive regulation of aconitate hydratase activity
GO:1904999 0.0064 319.2553 0.0064 1 2 positive regulation of leukocyte adhesion to arterial endothelial cell
GO:2000334 0.0064 319.2553 0.0064 1 2 positive regulation of blood microparticle formation
GO:0051186 0.0066 4.5996 1.1957 5 375 cofactor metabolic process
GO:0022407 0.0067 4.5869 1.1989 5 376 regulation of cell-cell adhesion
GO:0010594 0.0074 8.1333 0.3986 3 125 regulation of endothelial cell migration
GO:0045087 0.0074 3.8543 1.7442 6 591 innate immune response
GO:0006775 0.0075 16.6856 0.1307 2 41 fat-soluble vitamin metabolic process
GO:0051251 0.0077 5.5462 0.7844 4 246 positive regulation of lymphocyte activation
GO:0035821 0.0079 7.9365 0.4081 3 128 modification of morphology or physiology of other organism
GO:0061844 0.0079 16.2674 0.1339 2 42 antimicrobial humoral immune response mediated by antimicrobial peptide
GO:0035094 0.0083 15.8696 0.1371 2 43 response to nicotine
GO:0090199 0.0086 15.4907 0.1403 2 44 regulation of release of cytochrome c from mitochondria
GO:0045071 0.0094 14.7846 0.1467 2 46 negative regulation of viral genome replication
GO:0042214 0.0095 159.617 0.0096 1 3 terpene metabolic process
GO:0046136 0.0095 159.617 0.0096 1 3 positive regulation of vitamin metabolic process
GO:0052330 0.0095 159.617 0.0096 1 3 positive regulation by organism of programmed cell death in other organism involved in symbiotic interaction
GO:0052501 0.0095 159.617 0.0096 1 3 positive regulation by organism of apoptotic process in other organism involved in symbiotic interaction
GO:0060559 0.0095 159.617 0.0096 1 3 positive regulation of calcidiol 1-monooxygenase activity
GO:1903347 0.0095 159.617 0.0096 1 3 negative regulation of bicellular tight junction assembly
GO:0042110 0.0097 4.1815 1.3105 5 411 T cell activation
GO:0034113 0.0098 14.4551 0.1499 2 47 heterotypic cell-cell adhesion

Differential Variability

GO enrichment analysis was also performed for differentially variable regions.

comparison
Hypermethylation/hypomethylation
ontology
regions
differential methylation measure

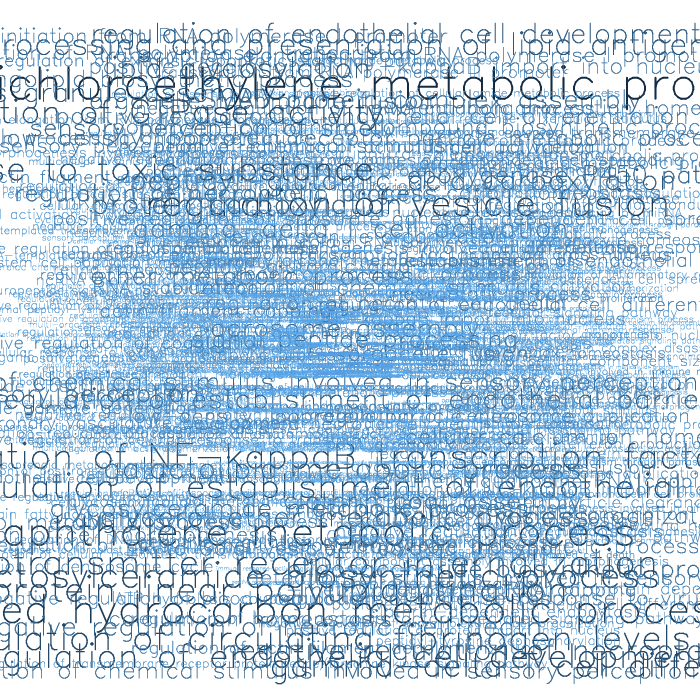
Figure 12

Figure 12

Workclouds for GO enrichment terms (Differential Variability)

comparison
Hypermethylation/hypomethylation
ontology
regions
differential methylation measure

GOMFID Pvalue OddsRatio ExpCount Count Size Term
GO:0002305 0.0024 Inf 0.0024 1 1 CD8-positive, gamma-delta intraepithelial T cell differentiation
GO:0018979 0.0024 Inf 0.0024 1 1 trichloroethylene metabolic process
GO:0007181 0.0048 429.0571 0.0048 1 2 transforming growth factor beta receptor complex assembly
GO:0018931 0.0048 429.0571 0.0048 1 2 naphthalene metabolic process
GO:0042197 0.0048 429.0571 0.0048 1 2 halogenated hydrocarbon metabolic process
GO:0031338 0.0076 16.6093 0.1315 2 55 regulation of vesicle fusion
GO:0006432 0.0095 143 0.0096 1 4 phenylalanyl-tRNA aminoacylation
GO:0006682 0.0095 143 0.0096 1 4 galactosylceramide biosynthetic process
GO:0044537 0.0095 143 0.0096 1 4 regulation of circulating fibrinogen levels
GO:0097039 0.0095 143 0.0096 1 4 protein linear polyubiquitination
GO:0099590 0.0095 143 0.0096 1 4 neurotransmitter receptor internalization
GO:0032088 0.0096 14.6647 0.1483 2 62 negative regulation of NF-kappaB transcription factor activity

LOLA Enrichment Analysis

No LOLA Enrichment Analysis was conducted

References

  1. Phipson, B., & Oshlack, A. (2014). DiffVar: a new method for detecting differential variability with application to methylation in cancer and aging. Genome Biology, 15(9), 465
  2. Makambi, K. (2003) Weighted inverse chi-square method for correlated significance tests. Journal of Applied Statistics, 30(2), 225234