Preprocessing

Removal of SNP-enriched Probes

10131 sites were removed because they overlap with SNPs. The list of removed probes is available in a dedicated table accompanying this report.

Removal of Cross-reactive Probes

29922 probes were removed because their sequences are non-specific and have a high likelihood of cross-hybridization [1]. The list of removed probes is available in a dedicated table accompanying this report.

Greedycut

The Greedycut algorithm iteratively removes from the dataset probes and samples of highest impurity. These correspond to the rows and columns in the detection p-value table that contain the largest fraction of unreliable measurements. This section summarizes the results of applying Greedycut on the analyzed dataset.

Unreliable Measurements

We considered every β value to be unreliable when its corresponding detection p-value is not below the threshold T:

pT = 0.05

The figure below summarizes the observed number of unreliable measurements per probe and per sample.

Number of values per

Figure 1

Open PDF Figure 1

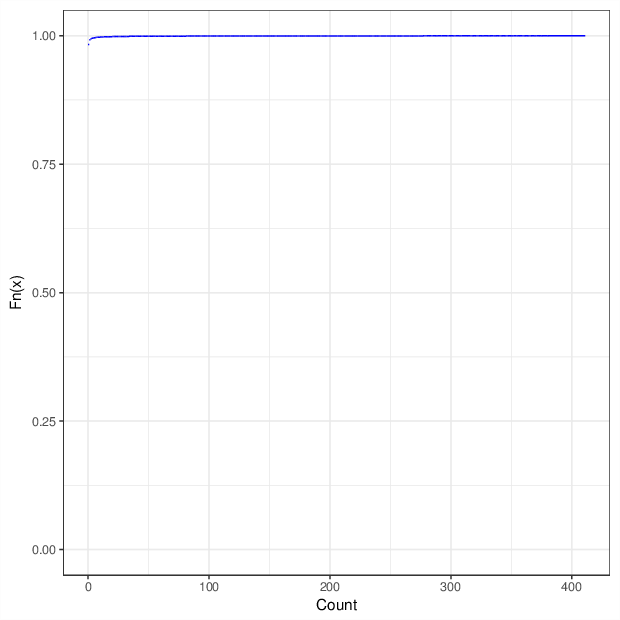
Cumulative distribution function of number of unreliable values per probe/sample.

Filtered Probes and Samples

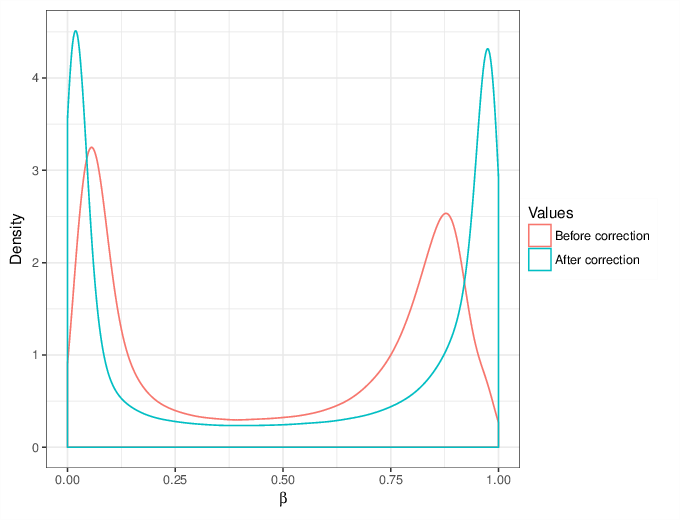
RnBeads executed Greedycut using the threshold given above and applied all its steps. Briefly, Greedycut is an iterative algorithm that filters out the probe or sample with the highest fraction of unreliable measurements one at a time. Note that every iteration of the algorithm produces a matrix of retained measurements and a set of removed ones.

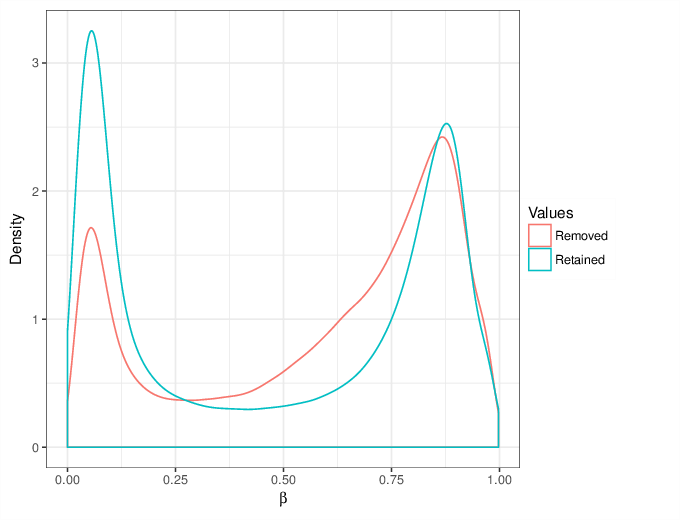
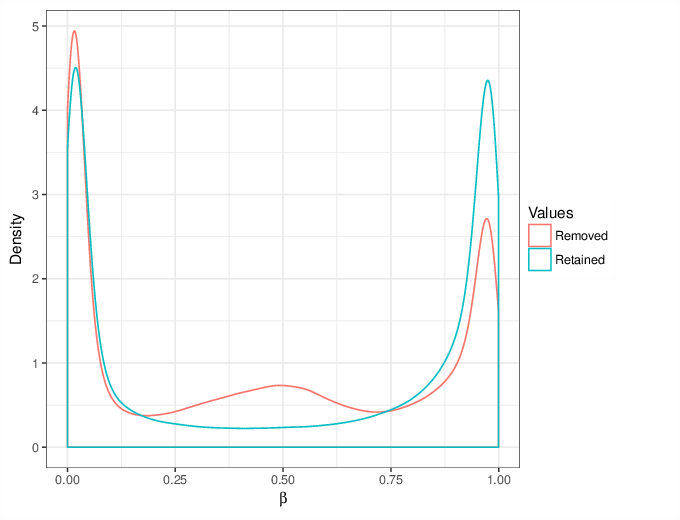
We calculated false positive rate (α) and sensitivity (s) when the retained measurements are considered as prediction for the reliable ones. Among all matrices produced by Greedycut, we selected the one that maximizes the value of the expression s + 1 - α, thereby giving equal weights to the sensitivity and specificity. Presented geometrically on a ROC curve, this is the point that is furthest from the diagonal. The results of the Greedycut procedure and the selected iteration are presented in the figure below.

Metric
Iterations to show

Figure 2

Open PDF Figure 2

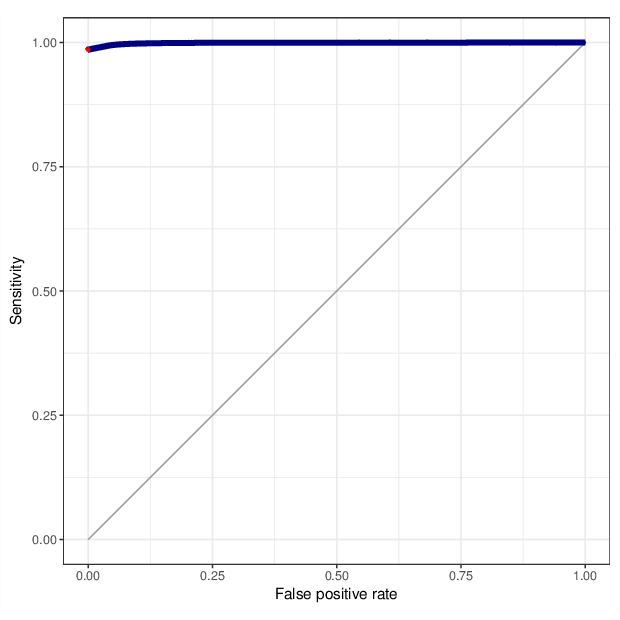
Change of table dimensions / metric related to accuracy as Greedycut progressively removes probes and samples. Accuracy is calculated by treating the retained entries as predictive of reliable measurements. The red circle, if present, marks the last iteration that was executed.

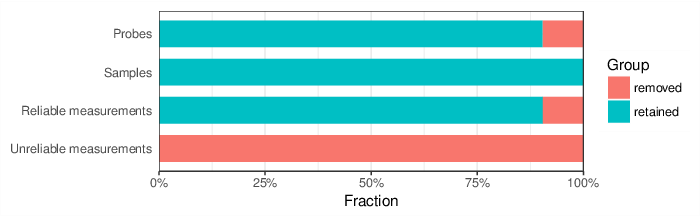
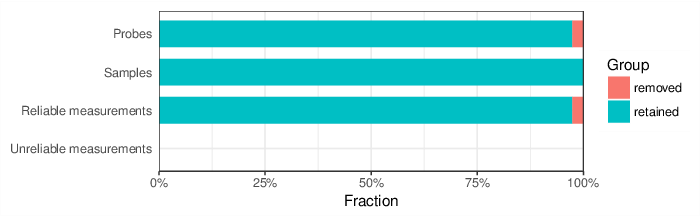
Based on the criteria described above, 6420 probes and 0 samples were filtered out. Links to the lists of removed items are given below.

Type Removed Table
Probes 6420 removed_sites_greedycut.csv
Samples 0

Filtering Summary I

As a final outcome of the filtering procedures, 46473 probes and 0 samples were removed (792 samples and 439104 probes were retained). These statistics are presented in a dedicated table that accompanies this report and visualized in the figure below.

Figure 3

Open PDF Figure 3

Fractions of removed values in the dataset after applying filtering procedures.

The figure below compares the distributions of the removed methylation β values and of the retained ones.

Plot type

Figure 4

Open PDF Figure 4

Comparison of removed and retained β values.Both distributions are estimated by randomly sampling 1000000 values in each group.

Normalization

The background was subtracted using the methylumi package (method "enmix.oob") [2].The methylation β values were normalized using the BMIQ normalization method [3].

Effect of Correction

This section shows the influence of the applied normalization procedure on CpG methylation values. The following figure compares the distributions of the β values before and after performing normalization.

Plot type

Figure 5

Open PDF Figure 5

Comparison of β values before and after correction.Both distributions are estimated by randomly sampling 1000000 values in each group.

The next figure gives an idea of the magnitude of the correction by showing the distribution of shifts, i.e. degrees of modification of the raw methylation values.

Figure 6

Open PDF Figure 6

Histogram of observed magnitude of β value correction.

The figure below gives a more detailed view. This color-coded 2D histogram shows the uncorrected β values and their respective shifts after performing the normalization procedure.

Figure 7

Open PDF Figure 7

2D histogram showing the raw β values and the magnitude of the corrections.

Sample Mean Methylations

The following figure visualizes the average methylation per sample. Samples are grouped by slide.

Slide number

Figure 8

Open PDF Figure 8

Point-and-whisker plot showing mean and standard deviation among all beta values in a sample.

Region Annotations

In addition to CpG sites, there is one set of genomic regions to be covered in the analysis. The table below gives a summary of these annotations.

Annotation Description Regions in the Dataset
promoters

Promoter regions of Ensembl genes, version Ensembl Genes 75

29427

Context-specific Probe Removal

The studied dataset contains in total 1318 probes of the specified contexts. All these (removed) probes are available in a dedicated table accompanying this report. The table below summarizes the number of removed probes per context.

Context Probes
CC 0
CAG 1090
CAH 157
CTG 7
CTH 0
Other 64

Removal of Probes on Sex Chromosomes

10034 probes on sex chromosomes were removed at this step. The list of removed probes is available in a dedicated table accompanying this report.

Filtering Summary II

As a final outcome of the filtering procedures, 11352 probes and 0 samples were removed (792 samples and 427752 probes were retained). These statistics are presented in a dedicated table that accompanies this report and visualized in the figure below.

Figure 9

Open PDF Figure 9

Fractions of removed values in the dataset after applying filtering procedures.

The figure below compares the distributions of the removed methylation β values and of the retained ones.

Plot type

Figure 10

Open PDF Figure 10

Comparison of removed and retained β values.Both distributions are estimated by randomly sampling 1000000 values in each group.

References

  1. Chen, Y., Lemire, M., Choufani, S., Butcher, D.T., Grafodatskaya, D., Zanke, B.W., Gallinger, S., Hudson, T.J., Weksberg, R. (2013) Discovery of cross-reactive probes and polymorphic CpGs in the Illumina Infinium HumanMethylation450 microarray. Epigenetics, 8(2), 203-209
  2. Triche, T.J. Jr, Weisenberger, D.J., Van Den Berg, D., Laird, P.W., and Siegmund, K.D. (2013)Low-level processing of Illumina Infinium DNA Methylation BeadArrays. Nucleic Acids Research 41(7), e90
  3. Teschendorff, A. E., Marabita, F., Lechner, M., Bartlett, T., Tegner, J., Gomez-Cabrero, D. and Beck, S. (2013) A beta-mixture quantile normalization method for correcting probe design bias in Illumina Infinium 450 k DNA methylation data. Bioinformatics 29(2), 189-196